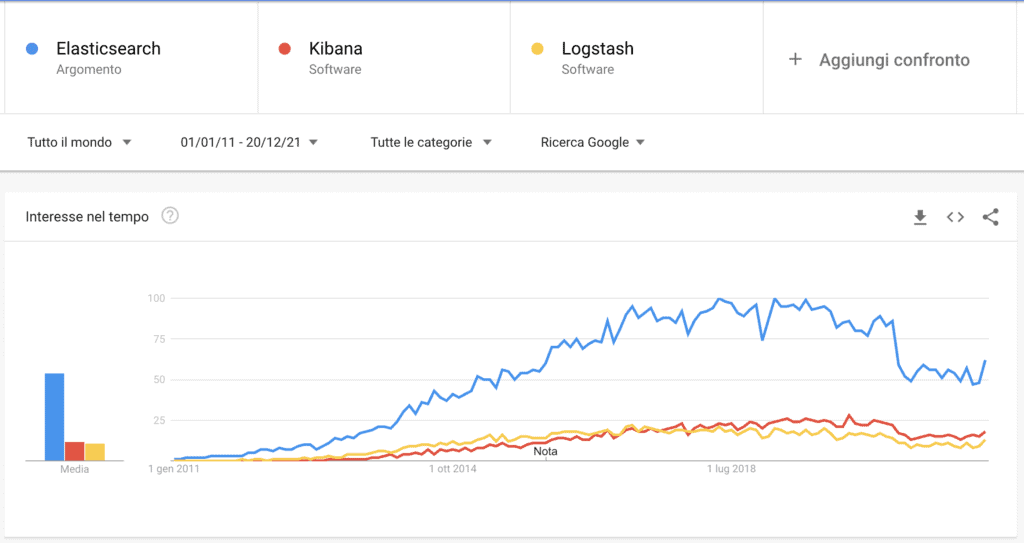
In recent years, the world of Elasticsearch has expanded considerably. Born as a NoSQL database to support text search using the Apache Lucene index, the project has seen the development of other open-source products: LogStash, Kibana and Beats.
Logstash is a log aggregator that collects data from various input sources (apps, databases, servers, etc.), performs various transformations and data cleaning, and finally sends the resulting data to various supported output destinations including Elasticsearch. Kibana, on the other hand, is a visualization tool that works on top of Elasticsearch, providing users with the ability to analyze and visualize data. Finally, Beats are software packages (agents) that are installed on hosts to collect different types of data to forward into the stack.
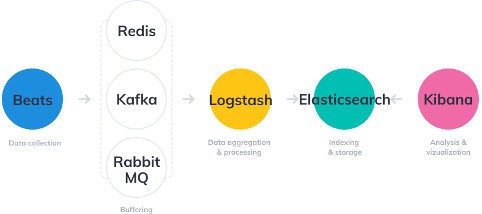
All of these components are most commonly used together for monitoring, troubleshooting, and securing IT environments (although there are many other use cases for ELK Stack such as business intelligence and web analytics). Beats and Logstash take care of data collection and processing, Elasticsearch indexes and stores the data, and Kibana provides a user interface to query and visualize the data.
Why ELK stack is popular?
As mentioned earlier, ELK stack represents an open-source solution for managing and analyzing large volumes of data including logs. Monitoring modern applications and the IT infrastructures over which they are deployed requires a log management and analysis solution to overcome the challenge of monitoring what are highly distributed, dynamic and noisy environments.

ELK Stack enables these tasks by providing users with a powerful platform that collects and processes data from multiple data sources and stores it in a centralized data repository. Moreover, it can scale as the data grows as well as provide a number of tools for data analysis.
Being open-source, you can install it on your own servers and manage it independently. There is also the cloud solution, available on a 14-day trial basis, which in many cases can be a very beneficial solution to implement a fast, highly reliable and secure data monitoring and/or analysis solution. Moreover, Kibana’s simple and intuitive interface ensures high operability even for non-expert users. Finally, the community is very active. This implies great support as well as constant implementation aimed at improving the entire stack.
Why is it important to analyze logs?
Nowadays, companies can’t afford downtime or slow performance from their applications. Performance issues can hurt a brand and in some cases translate into a direct loss of revenue. Suffice it to say that a site that is slow in loading pages, i.e., more than 5 seconds, can reduce new user engagement by more than 50%. Similarly, security issues and non-compliance with regulatory standards are also important.
In order to ensure the high availability, high reliability, and security of applications, we rely on the different types of data generated by the applications themselves and the infrastructure that hosts them. This data, whether it’s event logs or metrics, or both, allows systems to be monitored and problems to be identified should they occur. In this way, solutions can be studied to improve software, architecture, and/or intervene promptly should a Deny Of Service (DOS) occur.
Logs have always existed and so have the various tools available to analyze them. What has changed, however, is the architecture underlying the environments that generate these logs. The architecture has evolved into microservices, containers (e.g. Docker, Kubernets) and orchestration infrastructures deployed on the cloud or in hybrid environments. In addition, the volume of data generated by these environments is constantly growing which is a challenge in itself.
Centralized log management and analysis solutions such as ELK Stack, allow you to get an overview of the information captured and consequently ensure that apps are reliable and performing at all times.
Modern log management and analysis solutions include the following key capabilities:
- Aggregation: the ability to collect and send logs from multiple data sources
- Processing: the ability to transform log messages into meaningful data for easier analysis
- Storage: the ability to store data for extended periods of time to enable monitoring, trend analysis, and security use cases
- Analytics: the ability to dissect data by querying it and creating visualizations and dashboards about it
How to use ELK stack for log analysis
The various components of ELK Stack are designed to interact with each other without too much configuration. However, the way you design the stack can differ greatly depending on your environment and use case.
For a small development environment, the classic architecture will be as follows.

However, to handle more complex pipelines built to handle large amounts of data in production, additional components are likely to be added to your logging architecture, for resiliency (Kafka, RabbitMQ, Redis) and security (nginx).

This is obviously a simplified diagram for illustrative purposes. A full production architecture will consist of multiple Elasticsearch nodes with full replicas in different regions of your data center or cloud in order to ensure high data and service availability. In some cases, multiple instances of Logstash and alerting plugins will also be required.
Just log analysis?
Elasticsearch, of course, is not only used for log analysis. Its architecture can also be used for the analysis of other types of data, such as those coming from the Internet Of Things (IOT) or from e-commerce transactions.
In fact, thanks to LogStash it is possible to define custom transformers for any type of data. Apache Lucene’s text indexing capabilities allow you to create search engines for unstructured data. Finally, with the different visualization tools offered by Kibana you can create dashboards for different analysis purposes. Access management, user roles and workspaces ensure the creation of environments oriented to the needs of the different professionals in a company who need to analyze data.
Is ELK stack the only solution?
The answer to the title question is clearly NO! As also seen in other articles on this blog, Data lakes: GCP solutions and MongoDB Compass – extract statistics using aggregation pipeline, there are also other tools that allow data capture and analysis.
MongoDB, being the most popular NoSQL database, offers several opportunities to store and analyze different types of data, even heterogeneous ones. Through appropriate modeling methods, described in the book Design with MongoDB: Best models for applications, it is possible to optimize the required storage space as well as increase the analysis performance. Unlike Elastisearch, document polymorphism in MongoDB allows you to store even information with different characteristics mapped to the same field. In contrast, text analysis is not as performant and precise as in Elasticsearch. Only through Atlas Search, a paid feature on the cloud, you can get comparable results. Similar discourse for the creation of dashboards. MongoDB Charts is definitely a good product but it is not available outside the cloud.
Another solution is for example a cloud service with GCP. In Google’s environment you can create even very complex architectures to do data ingest and related analysis. You can leverage PubSub tools for data capture, storage to create datalakes, and BigTables for building data warehouses. Finally, with Google Data Studio you can create dashboards for sharing analytics. Apart from the last tool that can also be used at no cost, all other solutions require an expense based on the use of cloud resources. For this reason, its use is usually limited to very complex environments where data analysis for monitoring only is not the core of the system.
So, depending on the resources available to you, the use case, and your expertise, you can choose the solution that best meets your needs. All are very valuable, but they answer different questions (and in some cases, different pockets!).


One Response