Data scientists are primarily concerned with developing algorithms and/or frameworks to analyze the data of their interest. However, the result of their work many times results in graphs and tables showing the results obtained with different experiments, configurations and data. This aspect can be limiting in that their product remains code that is difficult for others to use. Instead, it would be much more useful to provide what has been developed through a web application so as to give more visibility to the results but more importantly to exploit the developed algorithm or framework in a user-friendly environment.
Obviously, developing web applications takes time, but it also requires technical skills that sometimes data scientists do not master properly. For this reason, frameworks have sprung up that make it easy to develop Web applications quickly. We have already seen in the articles Streamlit: Build a Web App in minutes, Streamlit: how to improve the user experience of a web app, and OpenCV and Streamlit: create a photo editing app, a Python library used for this purpose. In this article we will look, however, at Gradio, which similarly allows you to create web apps but is more oriented toward providing interfaces to leverage artificial intelligence or machine learning models.
What is Gradio?
Gradio is an open-source Python package that allows you to quickly create easy-to-use and customizable UI components for your own Machine Learning (ML), Deep Learning and/or Large Language Model (LLM) model, for any API or even for a Python function we create, using just a few lines of code. You can, moreover, integrate the Gradio GUI directly into your Jupyter notebook or share it as a link with anyone. Before we delve into the components of Gradio, let’s see how to set up our working environment.
Installing Gradio
Installation of Gradio can be done using pip from the command prompt or in Google Colab.
pip install gradio
If you are using a Jupyter notebook, you can also type the following:
!pip install gradio
The examples we will see below will be executed in Colab.
How to run Gradio applications
Now that we have Gradio installed on our system, let’s start looking at how to run Gradio applications.
Consider a simple Python application that takes as input a user’s name and generates a greeting message for the user.
					import gradio as gra
def user_greeting(name):
    return "Hi! " + name + " Welcome to your first Gradio application!😎"

#define gradio interface and other parameters
app =  gra.Interface(fn = user_greeting, inputs="text", outputs="text")
app.launch()
After importing the Gradio library, and any libraries that are needed, we define a function that returns a custom message based on the parameter passed. At this point in the main body of the script we create an app variable that contains our interface. To execute it we will only need to use the launch() function associated with the app variable. Here is the result we will get.
Run the application from the command prompt
You can also run the application using the command prompt. From the command prompt, run:
gradio app.py
To view the application, open the URL: http://localhost:7862. This may be different in your case.
Running the application from Jupyter Notebook
Alternatively, you can run the code in Jupyter Notebook. In this case a new widget will be created.
Interface class
In the previous example, we saw how simple it is to create an interface in gradio. Interface, in fact, is the main high-level class that allows you to create the graphical interface for machine learning functions and models. From the application we defined above, you will notice that the class requires three parameters, namely Interface(fn, input, output, …).
fn is an arbitrary function or machine model that is included in the Gradio interface. The function accepts at least one parameter and returns one or more values:
- Input: defines the type of input component. Gradio provides many preconstituted components, such as text, image, or microphone. The number of input components must equal the number of parameters specified in fn. If inputs are set to None, only output components are shown.
- Output: specifies the type(s) of output components. Gradio provides many predefined output components, such as images, text, or labels. The number of output components must compare with the number of values returned by fn. If outputs are set to None, only input components are displayed.
For more parameters and their functions, we recommend that you consult the Gradio documentation.
It is also possible to create several interfaces. In this case, Gradio provides classes such as TabbedInterface, Parallel and Series to combine them together.
For example, starting with the welcome application, we can define another arbitrary function that displays what the user wants to do and use TabbedInterface to combine the interfaces.
					import gradio as gr

title = "Multiple Interfaces"

#app 1
def user_greeting(name):
    return "Hi! " + name + " Welcome to your first Gradio application!😎"

#app 2
def user_help(do):
    return "So today we will do " + do + "using Gradio. Great choice!"

#interface 1
app1 =  gr.Interface(fn = user_greeting, inputs="text", outputs="text")
#interface 2

app2 =  gr.Interface(fn = user_help, inputs="text", outputs="text")

demo = gr.TabbedInterface([app1, app2], ["Welcome", "What to do"])

demo.launch()
The resulting application will be as follows.
Components
In the previous examples we used only simple unput and output components. Gradio fontains many other pre-built components for various functions. These components range from text and media such as audio, images, and video to graphics created with packages such as Plotly and Altair. In this section we will explore how Gradio displays the various components.
Displaying text
Text can be displayed using gradio.Text or gradio.Textbox. Each method provides a text area for entering strings or displaying string output.
					#display a text
import gradio as gr

def text_display(text):
    return text

demo = gr.Interface(text_display, gr.Text(), "text")
#alternatively use gr.TextBox()
demo.launch()
Data visualization
Data types such as “str,” “number,” “bool,” “date,” and “markdown” can be displayed in Gradio. By default, a Pandas DataFrame is used.
Other data types can be obtained by specifying the desired output type. For example, you can get a NumPy array when you specify numpy and array for a Python array.
					#display a data
import gradio as gr

def data_display(input_img):
    return input_img

demo = gr.Interface(data_display, gr.Dataframe(), "dataframe")
demo.launch()
Displaying media
In Gradio you can display media such as images. Also, you can transform images by applying a filter such as sepia or blue filter. You can display media by passing the correct input as Image, Video, Audio, or File.
The following example shows how to display an image after applying a blue tone filter.
					import numpy as np
import gradio as gr

def blue_hue(input_img):
    blue_hue_filter = np.array([
            [0.272, 0.534, 0.131],
            [0.349, 0.686, 0.168],
            [0.393, 0.769, 0.189]])
    blue_hue_img = input_img.dot(blue_hue_filter.T)
    blue_hue_img /= blue_hue_img.max()
    return blue_hue_img

demo = gr.Interface(blue_hue, gr.Image(), "image")
demo.launch()
Alternatively, video media can be viewed as follows, without any preprocessing:
					#display a video
import gradio as gr

def video_display(input_img):
    return input_img

demo = gr.Interface(video_display, gr.Video(), "video")
demo.launch()
Code visualization
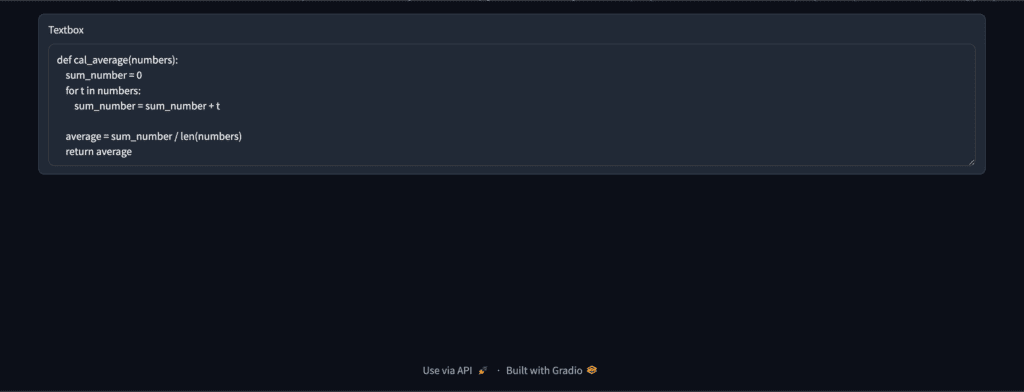
We can use gradio.Textbox to display some source code of our liking.
					import gradio as gr
#define your code
#average of a list
code = '''def cal_average(numbers):
    sum_number = 0
    for t in numbers:
        sum_number = sum_number + t

    average = sum_number / len(numbers)
    return average'''

with gr.Blocks() as demo:
    gr.Textbox(code)

demo.launch()

Displaying the progress
To show the progress and status of the current process, specify show_progress = ‘full’ in components that support change(). For example in gradio.Textbox.change() or gradio.Slider.change().
The status of the underlying process is displayed by specifying the show_progess parameter in change().
					import gradio as gr

def show_text(x):
    return x


demo = gr.Blocks()

with demo:
    gr.Markdown(
        """
    # Show text!
    Start typing below to see the output.
    """
    )
    input = gr.Textbox(placeholder="Flip this text")
    output = gr.Textbox()

    input.change(fn=show_text, inputs=input, outputs=output, show_progress = 'full')

demo.launch()
As you can see every time you type something the output interface is reloaded. If we want to avoid this behavior we must use show_progress = ‘hidden’ you will get the following result:
Graph visualization
Graph elements are displayed in Gradio using the gradio.Plot() component. After creating the graph, you can specify fn = your_ploting_function, input = None and output = gradio.Plot().
Below is the code for generating a graph using the Plotly library.
					import plotly.express as px
import pandas as pd
def plotly_plot():
    # prepare some data
    x = ["Math", "Business", "Statistics", "IT", "Commerce"]
    y = [68, 73, 82, 74, 85]
    data = pd.DataFrame()
    data['Subject'] = x
    data['Score'] = y
    # create a new plot
    p = px.bar(data, x='Subject', y='Score')

    return p

# show the results
outputs = gr.Plot()

demo = gr.Interface(fn=plotly_plot, inputs=None, outputs=outputs)

demo.launch()
This will be the final result.
We can also use Matplotlib to generate the graphs we want to display. Below is the code to generate our bar graph.
					import matplotlib.pyplot as plt
def plt_plot():
    # prepare some data
    x = ["Math", "Business", "Statistics", "IT", "Commerce"]
    y = [68, 73, 82, 74, 85]
    # create a new plot
    plt.rcParams['figure.figsize'] = 6,4
    fig = plt.figure()
    ax = fig.add_axes([0,0,1,1])
    ax.bar(x, y)
    plt.title("Marks per subject")
    plt.xlabel("Subject")
    plt.ylabel("Score")

    return fig

# show the results
outputs = gr.Plot()

demo = gr.Interface(fn=plt_plot, inputs=None, outputs=outputs)

demo.launch()
The result will be as follows.
Event listeners
An event listener starts a predefined process if a specific event occurs. Therefore, different components have different event listeners. For example, the component gradio.Video() supports a play() event listener, which is triggered when the user presses play, while gradio.Text() supports a change() event listener, which changes the text as it is typed.
					import gradio as gr

def welcome(name):
    return f"Welcome back, {name}!"

with gr.Blocks() as demo:
    gr.Markdown(
    """
    Type anything to see the output
    """)
    inp = gr.Textbox(placeholder="Enter your name")
    out = gr.Textbox()
    inp.change(welcome, inp, out)

demo.launch()
This will be the final result.
Streaming components
During streaming, data is continuously sent to the backend while the interface is running continuously. Some components such as Audio have a microphone mode for streaming, and the Image component also has a webcam for streaming.
During streaming, additional permissions are required to access the audio and camera, depending on the type of streaming.
					import gradio as gr
import numpy as np

def flip(im):
    return np.flipud(im)

demo = gr.Interface(
    flip,
    gr.Image(sources="webcam", streaming=True),
    "image",
    live=True
)
demo.launch()
Here is the result we get with the code given above.


One Response