In the previous article Gradio: web applications in python for AI [part1], we introduced Gradio, a library for quickly developing web applications for our machine learning and artificial intelligence models. The examples we saw used the main components provided by Gradio to handle inputs and outputs. The library, however, allows us to do much more! We can, in fact, insert interactive elements, define a custom layout, and create applications with multiple pages. In this article we will elaborate more on these aspects through examples. Recall that all the code was run in Google Colab, but you can run it conveniently in a Jupyter notebook or directly from shell. Go see in article Gradio: web applications in python for AI [part1] how to properly configure the development environment and launch the application.
Interactive components
Interactivity is a key feature in web applications. The user must, in fact, be able to interact with the interface through buttons, selections, and data entry. Our machine learning and/or AI models always require input parameters that must be provided by the user. Let us see below the main components that we can include in our interface.
Button
Using gradio.Button() you can define a submit button for your application by specifying value = “Submit” and adding a gradio.Button.click() event.
					import gradio as gr

def combine(a, b):
    return "Hey! " + a + " " + b + '\n'+ " Welcome to Flowygo."

with gr.Blocks() as demo:
    txt = gr.Textbox(label="First Name", lines=2)
    txt_2 = gr.Textbox(label="Second Name")
    txt_3 = gr.Textbox(value="", label="Output")
    btn = gr.Button(value="Submit")
    btn.click(combine, inputs=[txt, txt_2], outputs=[txt_3])

if __name__ == "__main__":
    demo.launch()
Checkbox
In addition to the cursor, a checkbox can be added to make selections. The following example combines a cursor and a checkbox for time selection.
					import gradio as gr

def sentence_builder( morning):
    return f"""It is a nice time take a {"morning" if morning else "later in the day"} glass of water"""

demo = gr.Interface(
    sentence_builder,
    [
        gr.Checkbox(label="Is it before noon"),
    ],
    "text")

if __name__ == "__main__":
    demo.launch()
Select box
A checkbox is created using gradio.CheckboxGroup(). This component allows you to specify a list of items to be selected.
					import gradio as gr

def sentence_builder(morning, activity_list):
    return f"""It is a nice time take a {"morning" if morning else "later in the day"} glass of water {" and take a ".join(activity_list)}"""

demo = gr.Interface(
    sentence_builder,
    [
        gr.Checkbox(label="Is it before noon"),
        gr.CheckboxGroup(["juice", "beverage", "snack", "nap"]),
    ],
    "text")

if __name__ == "__main__":
    demo.launch()
Date input
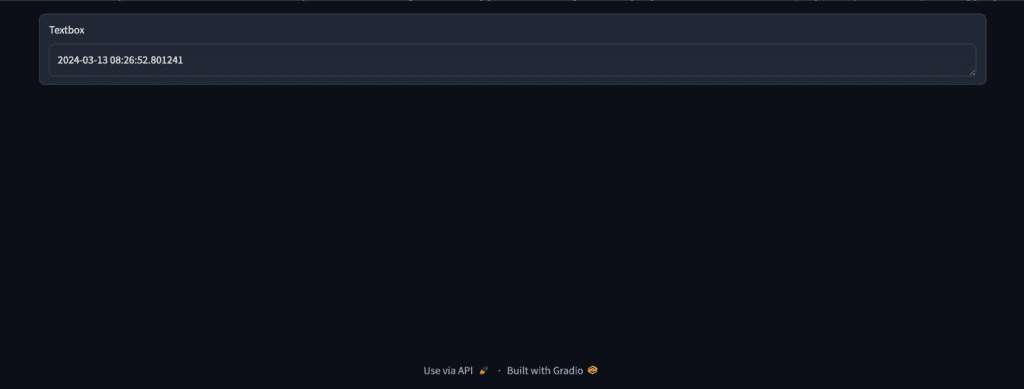
Currently, Gradio does not support selecting dates via a widget. However, you can display the current date among other operations by using datetime as an input in the Textbox() component.
					import gradio as gr
import datetime

with gr.Blocks() as demo:
    gr.Textbox(datetime.datetime.now)

demo.launch()
Colorpicker
To generate random colors, you can use gradio.ColorPicker().
					import gradio as gr
import cv2
import numpy as np
import random

# Convert decimal color to hexadecimal color
def RGB_to_Hex(rgb):
    color = "#"
    for i in rgb:
        num = int(i)
        color += str(hex(num))[-2:].replace("x", "0").upper()
    return color

# Randomly generate light or dark colors
def gen_random_color(is_light=True):
    return (
        random.randint(0, 127) + int(is_light) * 128,
        random.randint(0, 127) + int(is_light) * 128,
        random.randint(0, 127) + int(is_light) * 128,
    )

def change_color(color_style):
    if color_style == "light":
        is_light = True
    elif color_style == "dark":
        is_light = False
    back_color_ = gen_random_color(is_light)  # Randomly generate colors
    back_color = RGB_to_Hex(back_color_)  # Convert to hexadecimal

    # Draw color pictures.
    w, h = 50, 50
    img = np.zeros((h, w, 3), np.uint8)
    cv2.rectangle(img, (0, 0), (w, h), back_color_, thickness=-1)

    return back_color, back_color, img


inputs = [gr.Radio(["light", "dark"], value="light")]

outputs = [
    gr.ColorPicker(label="color"),
    gr.Textbox(label="hexadecimal color"),
    gr.Image(type="numpy", label="color picture", height=200),
]

title = "Random Color Generator"
description = (
    "By clicking submit, a new color will be generated"
)

demo = gr.Interface(
    fn=change_color,
    inputs=inputs,
    outputs=outputs,
    title=title,
    description=description,
)

if __name__ == "__main__":
    demo.launch()
Slider
gradio.Slider() creates a slider with a range of values from minimum to maximum and a step size. The default position of the slider is specified by the value parameter. For example, below is an implementation of the slider with minimum = 2, maximum = 24, step = 2, with default slider position.
					import gradio as gr

def sentence_builder(quantity, morning, activity_list):
    return f"""{quantity} o'clock is a nice time take a {"morning" if morning else "later in the day"} glass of water {" and take a ".join(activity_list)}"""

demo = gr.Interface(
    sentence_builder,
    [  gr.Slider(2, 24, value=4, step = 2),
        gr.Checkbox(label="Is it before noon"),
        gr.CheckboxGroup(["juice", "beverage", "snack", "nap"]),
    ],
    "text")

if __name__ == "__main__":
    demo.launch()
Dropdown
Gradio’s Dropdown() function allows us to specify an item from a list of possible items. For example, we can modify the previous application to define an additional parameter, called watch, that shows what a user might do as an alternative.
					import gradio as gr

def sentence_builder(quantity, morning, activity_list, watch):
    return f"""{quantity} o'clock is a nice time take a {"morning" if morning else "later in the day"} glass of water {" and take a ".join(activity_list)} or watch a {watch}"""

demo = gr.Interface(
    sentence_builder,
    [   gr.Slider(2, 24, value=4, step = 2),
        gr.Checkbox(label="Is it before noon"),
        gr.CheckboxGroup(["juice", "beverage", "snack", "nap"]),
        gr.Dropdown(["Television series", "Movie", "Documentary", "Class"]),

    ],
    "text")

if __name__ == "__main__":
    demo.launch()
Integration of visualization libraries
In addition to the components seen above, it can be very useful to insert graphical elements within our application. We have already seen some examples in article XXX. Here we show you how to use the Plot output component to create data graphs with various Python visualization libraries, including Matplotlib, Bokeh, and Plotly.
Using Matplotlib and Seaborn
To visualize data using Seaborn or Matplotlib in Gradio, it is necessary to use matplotlib.plot() or seaborn.plot() depending on the library used.
Matplotlib
					import gradio as gr
from math import log
import matplotlib
matplotlib.use('Agg')
import matplotlib.pyplot as plt
import numpy as np
import pandas as pd


def gdp_change(r, year, country, smoothen):
    years = ['1850', '1900', '1950', '2000', '2050']
    m = years.index(year)
    start_day = 10* m
    final_day = 10* (m + 1)
    x = np.arange(start_day, final_day + 1)
    pop_count = {"USA": 350, "Canada": 40, "Mexico": 300, "UK": 120}
    if smoothen:
        r = log(r)
    df = pd.DataFrame({'day': x})
    df[country] = ( x ** (r) * (pop_count[country] + 1))
    fig = plt.figure()
    plt.plot(df['day'], df[country].to_numpy(), label = country)
    plt.title("GDP in " + year)
    plt.ylabel("GDP (Millions)")
    plt.xlabel("Population Change since 1800")
    plt.grid()
    return fig

inputs = [
        gr.Slider(1, 4, 3.2, label="R"),
        gr.Dropdown(['1850', '1900', '1950', '2000', '2050'], label="Year"),
        gr.Radio(["USA", "Canada", "Mexico", "UK"], label="Countries", ),
        gr.Checkbox(label="Log of GDP Growth Rate?"),
    ]
outputs = gr.Plot()

demo = gr.Interface(fn=gdp_change, inputs=inputs, outputs=outputs)

demo.launch()
Seaborn
In a similar way we can use Seaborn. Therefore, we define a plotting function and place the graph as the output.
					import gradio as gr
from math import log
import seaborn as sns

import matplotlib.pyplot as plt
import numpy as np
import pandas as pd

def gdp_change(r, year, country, smoothen):
    years = ['1850', '1900', '1950', '2000', '2050']
    m = years.index(year)
    start_day = 10* m
    final_day = 10* (m + 1)
    x = np.arange(start_day, final_day + 1)
    pop_count = {"USA": 350, "Canada": 40, "Mexico": 300, "UK": 120}
    if smoothen:
        r = log(r)
    df = pd.DataFrame({'day': x})
    df[country] = ( x ** (r) * (pop_count[country] + 1))
    fig = plt.figure()
    sns.lineplot(x = df['day'], y = df[country].to_numpy())
    plt.title("GDP in " + year)
    plt.ylabel("GDP (Millions)")
    plt.xlabel("Population Change since 1800")
    plt.grid()
    return fig

inputs = [
        gr.Slider(1, 4, 3.2, label="R"),
        gr.Dropdown(['1850', '1900', '1950', '2000', '2050'], label="year"),
        gr.Radio(["USA", "Canada", "Mexico", "UK"], label="Countries", ),
        gr.Checkbox(label="Log of GDP Growth Rate?"),
    ]
outputs = gr.Plot()

demo = gr.Interface(fn=gdp_change, inputs=inputs, outputs=outputs)

demo.launch()
Plotly
It is also possible to use the Ploty library. In this case, in the plotting function gdp_change(…), we define a plotly display object and then pass it to gradio.Plot().
					import gradio as gr
from math import log
import matplotlib
matplotlib.use('Agg')
import matplotlib.pyplot as plt
import numpy as np
import plotly.express as px
import pandas as pd

def gdp_change(r, year, country, smoothen):
    years = ['1850', '1900', '1950', '2000', '2050']
    m = years.index(year)
    start_day = 10* m
    final_day = 10* (m + 1)
    x = np.arange(start_day, final_day + 1)
    pop_count = {"USA": 350, "Canada": 40, "Mexico": 300, "UK": 120}
    if smoothen:
        r = log(r)
    df = pd.DataFrame({'day': x})
    df[country] = ( x ** (r) * (pop_count[country] + 1))
    fig = px.line(df, x='day', y=df[country].to_numpy())
    fig.update_layout(title="GDP in " + year,
                yaxis_title="GDP",
                xaxis_title="Population change since 1800s")
    return fig

inputs = [
        gr.Slider(1, 4, 3.2, label="R"),
        gr.Dropdown(['1850', '1900', '1950', '2000', '2050'], label="year"),
        gr.Radio(["USA", "Canada", "Mexico", "UK"], label="Countries", ),
        gr.Checkbox(label="Log of GDP Growth Rate?"),
    ]
outputs = gr.Plot()

demo = gr.Interface(fn=gdp_change, inputs=inputs, outputs=outputs)

demo.launch()
Visualize maps
In addition to line graphs, it is, of course, possible to integrate other types of graphs. For example, we can create maps with the Plotly or Seaborn libraries, which are then displayed again using the gradio.Plot() function.
					import plotly.express as px
import pandas as pd
def map_plot():
  #define a map element
    df = px.data.gapminder().query("year==2002")
    fig = px.scatter_geo(df, locations="iso_alpha", color="continent",
                        hover_name="country", size="lifeExp",
                        projection="natural earth")
    return fig
outputs = gr.Plot()

demo = gr.Interface(fn=map_plot, inputs=None, outputs=outputs)

demo.launch()
Define the graphic layout
The layout of the application blocks can be customized using layout classes such as gradio.Row(), gradio.Columns(), gradio.Tab() and gradio.Accordion().
Rows
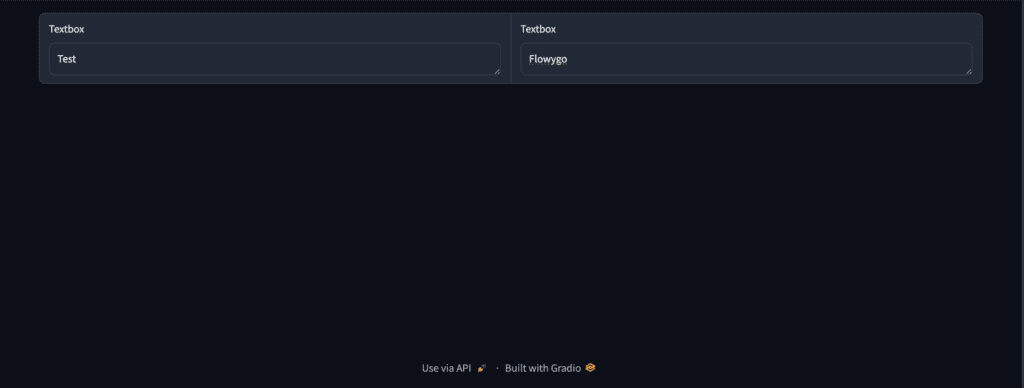
When using the row layout, all blocks in the application will be rendered horizontally.
					import gradio as gr
with gr.Blocks() as demo:
    with gr.Row():
        gr.Text()
        gr.Text()
demo.launch()
Columns
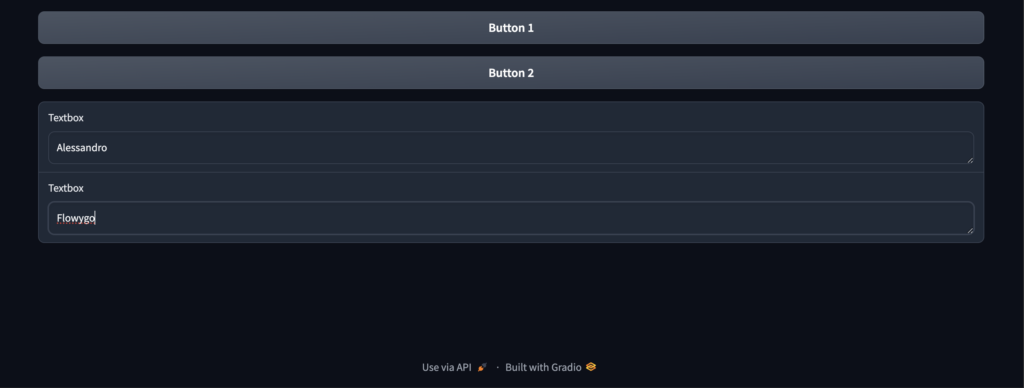
With gradio.Column() you can make the application blocks vertical. You can specify the width of the columns by specifying the scale and min_width parameters.
					import gradio as gr
with gr.Blocks() as demo:
    with gr.Column(scale=2):
         btn1 = gr.Button("Button 1")
         btn2 = gr.Button("Button 2")
    with gr.Column(scale=1):
         text1 = gr.Textbox()
         text2 = gr.Textbox()
demo.launch()
Tab and accordion
Gradio applications can also be laid out in tabular form using gradio.Tab(). The components of a particular tab will be displayed when the user navigates to the corresponding tab. Each tab is assigned a label.
					import gradio as gr
with gr.Blocks() as demo:
    with gr.Tab(label = "Button tab"):
         btn1 = gr.Button("Button 1")
         btn2 = gr.Button("Button 2")
    with gr.Tab(label = "Textbox tab"):
         text1 = gr.Textbox()
         text2 = gr.Textbox()
demo.launch()
An accordion returns the update() function of the component with the functionality to toggle and hide the content.
					import gradio as gr
with gr.Blocks() as demo:
    with gr.Accordion("Display Details"):
        gr.Markdown("Machine Learning and Big Data")
demo.launch()
Visibility
After passing a function into the Gradio interface or a block, a typical value is returned. In order to update the block, you can no longer use the update function, but must return the new component with the set parameters. In the next example we show how to display or not display a textbox and define the number of rows in it based on the user’s choices.
					import gradio as gr
def update_textbox(choice):
  if choice == "short":
      return gr.Textbox(lines=1, visible=True)
  elif choice == "long":
      return gr.Textbox(lines=6, visible=True)
  else:
      return gr.Textbox(visible=False)
gr.Interface(
  update_textbox,
  gr.Radio(
      ["short", "long", "No message"], label="What kind of message would you like to send?"
  ),
  gr.Textbox(lines=2),
  live=True,
).launch()
Custom CSS and Javascript
So far we have seen applications with a default layout from the library. However, you can create a custom style for your application by passing a CSS as an argument. For example, in the tab layout example, you can define a custom background CSS as follows:
					import gradio as gr
with gr.Blocks(css=".gradio-container {background-color: grey}") as demo:
    with gr.Tab(label = "Button tab"):
         btn1 = gr.Button("Button 1")
         btn2 = gr.Button("Button 2")
    with gr.Tab(label = "Textbox tab"):
         text1 = gr.Textbox()
         text2 = gr.Textbox()
demo.launch()
Similarly, custom JS can be defined for the application.
					import gradio as gr

blocks = gr.Blocks()

with blocks as demo:
    subject = gr.Radio(["Analyse", "Explore", "Learn"])
    verb = gr.Radio(["GDP Change", "Population Growth", "Big Data"])
    object = gr.Textbox(placeholder="region")

    with gr.Row():
        btn = gr.Button("Create sentence.")
        reverse_btn = gr.Button("Reverse sentence.")

    def sentence_maker(w1, w2, w3):
        return f"{w1} {w2} in {w3}"

    output1 = gr.Textbox(label="output 1")
    output2 = gr.Textbox(label="verb reversed")

    btn.click(sentence_maker, [subject, verb, object], output1)
    #custom JS to reverse the sentense
    reverse_btn.click(None, [subject, verb, object], output2, js="(s, v, o) => o + ' ' + v + ' ' + s")

demo.launch()
Multi-page applications
After creating several apps, you can use the following methods to combine them together in multiple pages:
- TabbedInterfaces() and gradio.Parallel() to compare outputs from multiple apps
- Series() to feed inputs from one app to another.
In this section, we will use gradio.TabbedInterface() to create a multi-page application for the previously created Dropdown and Seaborn apps.
					#define your first application
import gradio as gr
import seaborn as sns
import matplotlib.pyplot as plt
import numpy as np
import pandas as pd
from math import log
def user_greeting(name):
    return "Hi! " + name + " Welcome to your multi-page application!😎"

#app 1
app =  gr.Interface(fn = user_greeting, inputs="text", outputs="text", examples = ["Zenith", "Antoinne", "Amelia", "Johanna"])

#define your second application
def gdp_change(r, year, country, smoothen):
    years = ['1850', '1900', '1950', '2000', '2050']
    m = years.index(year)
    start_day = 10* m
    final_day = 10* (m + 1)
    x = np.arange(start_day, final_day + 1)
    pop_count = {"USA": 350, "Canada": 40, "Mexico": 300, "UK": 120}
    if smoothen:
        r = log(r)
    df = pd.DataFrame({'day': x})
    df[country] = ( x ** (r) * (pop_count[country] + 1))
    fig = plt.figure()
    sns.lineplot(x = df['day'], y = df[country].to_numpy())
    plt.title("GDP in " + year)
    plt.ylabel("GDP (Millions)")
    plt.xlabel("Population Change since 1800s")
    plt.grid()
    return fig

inputs = [
        gr.Slider(1, 4, 3.2, label="R"),
        gr.Dropdown(['1850', '1900', '1950', '2000', '2050'], label="year"),
        gr.Radio(["USA", "Canada", "Mexico", "UK"], label="Countries", ),
        gr.Checkbox(label="Log of GDP Growth Rate?"),
    ]
outputs = gr.Plot()

#app 2
app2 = gr.Interface(fn=gdp_change, inputs=inputs, outputs=outputs)
#combine to create a multipage app
demo = gr.TabbedInterface([app, app2], ["Welcome page", "Visualization page"])

if __name__ == "__main__":
    demo.launch()
