Gradio: web applications in python for AI [part2]

Gradio is a python library that allows us to create web applications quickly and intuitively for our machine learning and AI models. Our applications always require user interaction and layout customization. Let us find out, through examples, how to improve our applications.
Gradio: web applications in python for AI [part1]

Writing web applications for our machine learning and/or artificial intelligence models can take a lot of time and skills that we do not possess. To streamline and speed up this task we are helped by Gradio, a Python library designed to create web applications with just a few lines of code. Let’s discover its basic functionality with some examples.
AI: the best prompt techniques for leveraging LLMs

Prompt techniques are the basis for the use of LLMs. There are several studies and guidelines for obtaining the best results from these models. Let us analyze some of them to extract the basic principles that will allow us to obtain the desired answers according to our task.
AI: create a chatbot with your own data

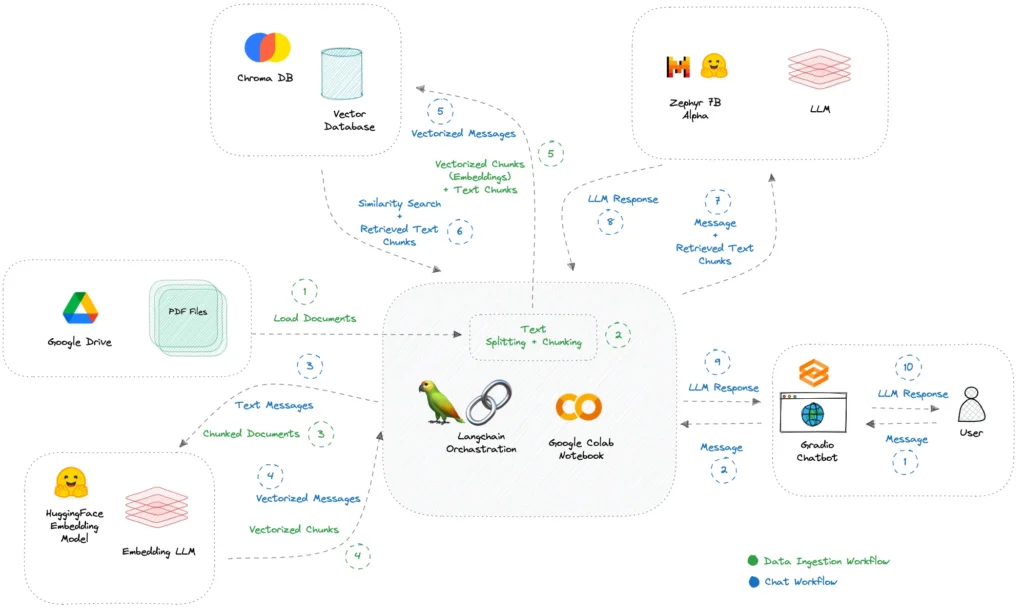
ChatGPT allows us to have a virtual assistant at our complete disposal. However, it has one major limitation: it does not know our private data. How can we build our own virtual assistant, or rather a chabot, that uses our data and does not require us to invest money? Let’s find out how to build one using open LLM, free computational environments such as Colab, and Python libraries to manage PDF files and create simple and intuitive web interfaces.
UX/UI design: useful applications

With Figma, the task of designing websites and/or applications has been greatly simplified. In just a few clicks, excellent results can be obtained immediately ready to present to stakeholders and/or developers. However, Figma is not the only tool that can be used! We will find out what other tools can be integrated into the work of designing user interfaces.
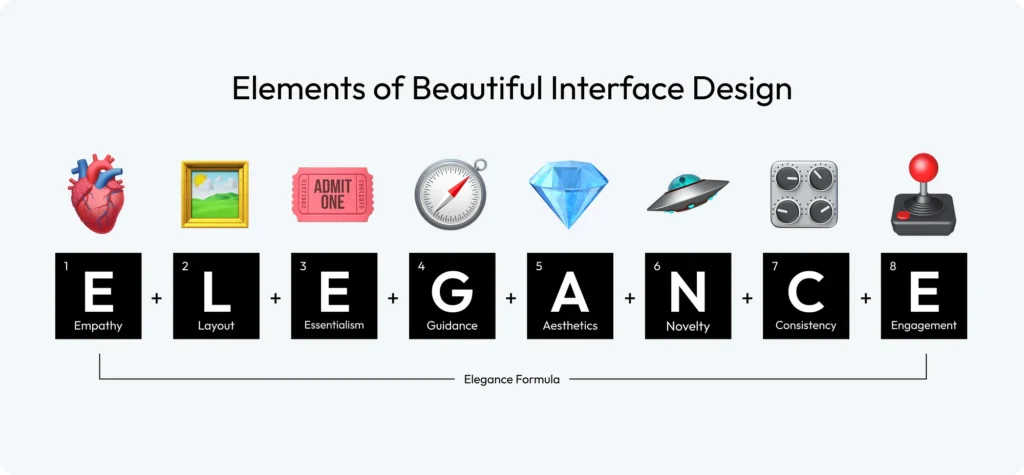
UX/UI: Elegance Formula

The definition and development of user interfaces that are attractive, engaging, but above all easy and intuitive is a fundamental step in any application or website. There are a few basic rules that one must consider, although our personal aesthetic and creative taste will then influence our choices. By following the Formula of Elegance, however, fewer mistakes will be made and the final product will be as intuitive and inclusive as possible.
The best Python frontend libraries for data science

Developing web and desktop applications requires knowledge of several programming languages. Defining user interfaces is a fundamental aspect of providing a good user experience (UX) and viewing information in an effective and appealing manner. For those involved in analysing data or collecting it, however, this aspect is critical. In fact, many developers specialise in one language and are reluctant to expand their knowledge to other languages or tasks that are not their core business. For this reason, in this article we present five libraries in python that can facilitate and speed up the development of user interfaces.
Exploring artificial intelligence: deep learning project ideas

Artificial intelligence has been gaining enormous interest in recent times. The application of deep learning and AI models to real scenarios has opened up new horizons. To generate models for our applications, however, we need data on which to train these models. Let us explore some ideas that could enable us to create new applications and services.
ElasticSearch: how and when to use it

Textual search engines are a feature that plays an important role in the construction of applications. The user experience is greatly improved if the results requested are truly inherent to the words entered in the search bar. Elasticsearch allows us to integrate a full-text search system and obtain excellent results efficiently. Let us find out how and when it is possible to exploit these features.
Prompt engineering: prompting techniques [part 2]

The techniques proposed by prompt engineering allow even very complex tasks to be performed. Some of them, such as zero-shoot, few-shoot and Chain-of-Thought (CoT), manage to provide excellent results in some contexts. Where models have limitations, however, they can be remedied by even more advanced techniques such as Self-Consistency, Generated Knowledge and Tree of Thoughts.
