About last time…
Before starting with the new tasks, we should recall what we did in part 1. The overall objective of this tutorial is to understand and integrate the MySQL connector in our Google Data Studio reports, focusing on the different SQL queries. As a case study, we are considering a retailer of scale models of classic cars (https://www.mysqltutorial.org/mysql-sample-database.aspx). Now, it’s time to play a little bit more with our data!
Customers origin
Things get more interesting if you look at the customer table. In particular, it would be appealing for the company to have a geographical overview of the origin of orders. Understanding the customers’ specifications is always a key aspect to evaluate the performance and prepare specific strategies.
Question 5a.
Insert a new data source to access customers information. Define efficiently the SQL query by importing only the necessary columns to provide the geographical insights about the orders origin. Then, try to use a Bubble Map for representation. Remember to choose the Location field and to set the useful metric for the bubbles size.
TIP.
Once a new table has been imported, Data Studio automatically makes available the Record Count metric.
Question 5b.
Keep updated the summary box designed for Question 4b of the previous tutorial. Prepare another Scorecard to report the total number of tracked customers. Use texts and shapes to explain your data!
Focus on US customers
Retrieving data is typically a matter of filters to highlight and deal with the essential information only. Until now, we have limited ourselves to the basics of the SELECT command, but it is significantly useful to include some specific clauses in our queries with WHERE.
Question 6.
To learn more about a particular type of clients, the company would expect to extract – based on your report – a list of clients from the U.S. (i.e. USA) with a credit limit greater than $100k. After defining the custom query to filter data accordingly, insert a table reporting the customer name and the credit limit expressed in USD. Sort the results by credit limit (descending order).
Investigating order details
Once observed the customers, it is time to analyze the performed orders more in detail. In particular, this is helpful to gain confidence with some advanced constructs. In fact, while querying the database, you can apply specific mathematical functions to retrieve additional information.
Question 7a.
Look again at the columns available for the orderdetails table. Can you define the SQL query to return the order numbers and the total amount of each order?
TIP.
Remember to group your orders according to the order number. Moreover, renaming columns (especially if you apply mathematical functions) is always a good idea.
Question 7b.
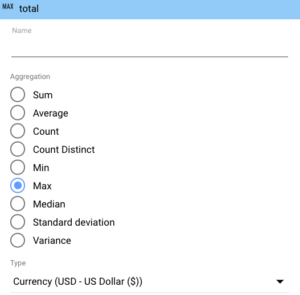
Complete the summary box with the information you have just retrieved. Create two Scorecards to express respectively the maximum and average amount of the given orders. In Google Data Studio, the faster approach is to use the customization menu available for the considered metric (Figure 1). It is accessible from the pencil icon next to the metric name.
Staff and Offices
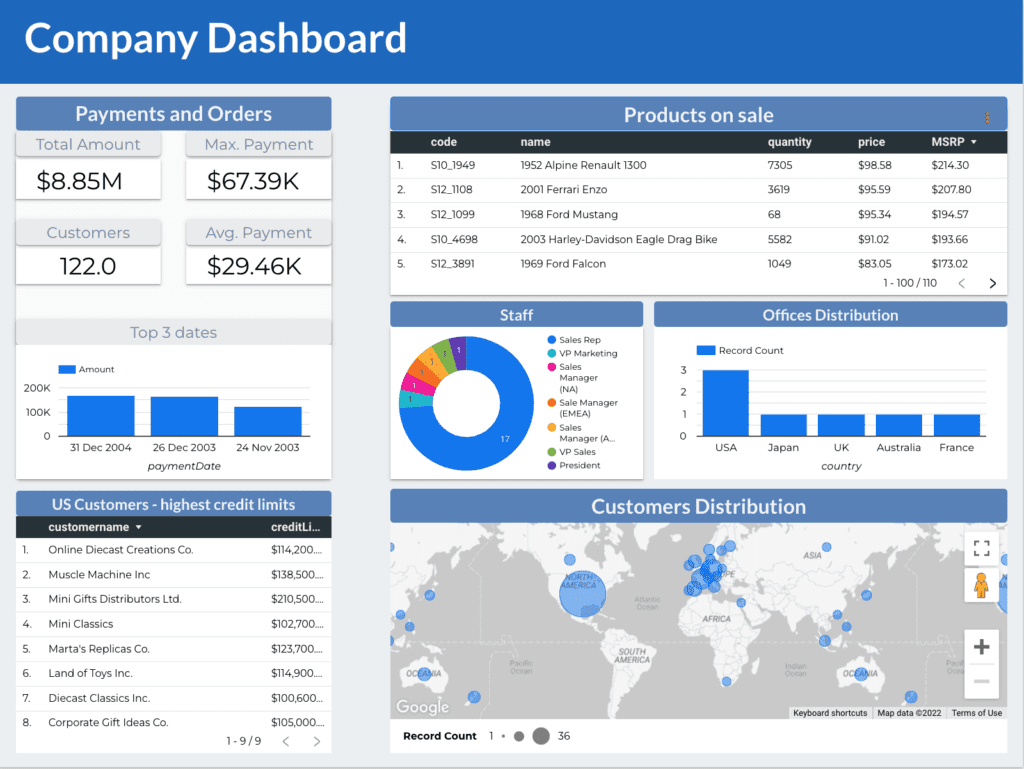
The last step consists in providing an intuitive overview about the staff members and the available offices. These additional insights make the report more complete and ensure that we have studied most of the database. At the end, you can design a report similar to the one shown in Figure 2.
Question 8a.
Investigate the composition of the company staff. Use the employees table to select the job titles. Include in your report a Doughnut chart to understand the proportions. You should notice a particularly crowded department compared to the others. In this case, visualizing the absolute value of each slice is more useful to have an idea about the number of employees.
Question 8b.
Given its multinational nature, the company is careful to emphasise the presence of offices around the world. Support the above analysis by delving into the information stored in the offices table. Define the proper query and prepare a Bar chart to present the number of offices per each country in descending order.
Customize and share the Google Data Studio report
We have successfully imported all the necessary information to complete our dashboard according to the fixed requirements. Now, leave space to creativity. Customize your report layout to present a valuable, clear and informative work.
Question 9.
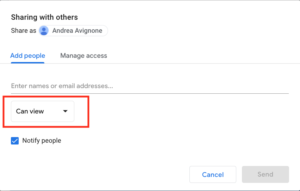
Complete the report by focusing on the stylistic customization of each single block. Feel free to design it the exact way you find most convenient and observe the final result in View mode. Finally, test the Share button with any of your colleagues to perform the invitation to collaborate. As you can notice in Figure 3, you need to specify if the other members can view or edit the project.
(Bonus) PhpMyAdmin – brief introduction
As we have already mentioned, phpMyAdmin is an administration tool to manage your databases. It offers an intuitive GUI to create and visualize databases with several functions, including SQL queries, tables configuration and users privileges.
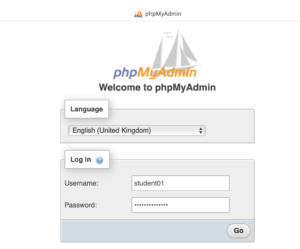
The login page is shown in Figure 4 in which you have also the possibility to choose the language.
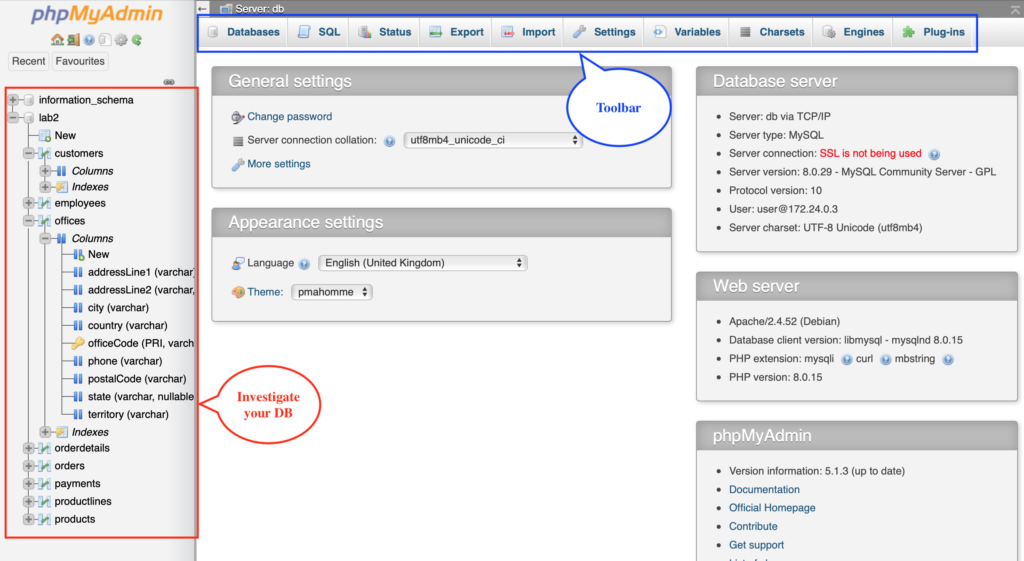
Once logged in, the homepage is extremely user-friendly. As you can observe in Figure 5, on the left, you can explore the databases you have access to. This is helpful to investigate the database structure and the information stored for each table. In fact, you can click on each single column to learn more.
On the top instead, there is the toolbar you can use for all the actions you need. For example, from Databases you can access the existing ones or create a new database according to the desired specifications (if you have the privileges). By selecting a specific database instead, you can explore the structure, create new tables or search for specific fields.
It is interesting that when you browse the available tables, phpMyAdmin automatically generates the corresponding query. In Figure 6, the city column was clicked to sort by city and the query on the top was then obtained.
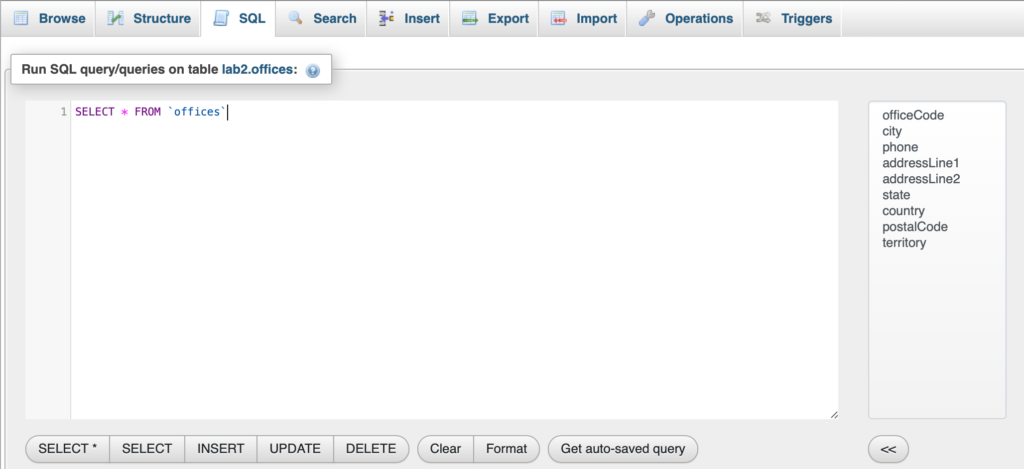
If the previous feature is important to get familiar with SQL queries while using a graphical interface, to take a step further you should refer to Figure 7. Clearly, phpMyAdmin supports the possibility to integrate SQL scripts to execute different queries. This is useful to be completely free of facing your data and creating new tables if you need them.

PhpMyAdmin in a nutshell
However, phpMyAdmin offers several features and operations that can be extremely useful. Besides those already mentioned, we can briefly summarize the main possibilities:
Create/remove/rename databases, tables and fields, with support to SQL queries.
Status. Retrieve information about the traffic (received and sent) and connections concerning the MySQL server.
Export. Export databases from the server according to the desired format. You can choose among different file types, including: SQL, JSON, CSV, PHP array. This is useful to migrate databases, associated with the import function.
Import. Upload your databases into the server based on a specific file (format examples: SQL, CSV, XML).
Settings. Customize user preferences related to the current session.
Documentation. PhpMyAdmin is certainly a user-friendly tool and it is easy to gain confidence with. In addition, it offers the detailed documentation to learn more about installation, configuration and general features.
Designer. For each database, users can access this graphical function to create, edit or understand the database schema.

