
Summary and objectives
As you remember from the previous laboratory activity (part 1 and part 2), Google Data Studio is highly flexible to different data sources. If data samples and Google Sheets are probably the most intuitive, the other alternatives represent more convenient solutions to interact with real-life cases for data visualization. At the end of this laboratory, you should acquire some useful experience with:
- Leveraging the skills of the Data Studio environment learned in the last lab to have them applied to a new scenario.
- Investigating the structure of a complete database with multiple tables to perform the main SQL queries.
- Connecting your report with the MySQL Relational Database Management System (RDBMS) by exploiting the provided Google Connector.
- Observing the preliminary usage of databases administration tools like phpMyAdmin
to have a graphical interface for managing your database.
Google Data Studio and MySQL – Overview
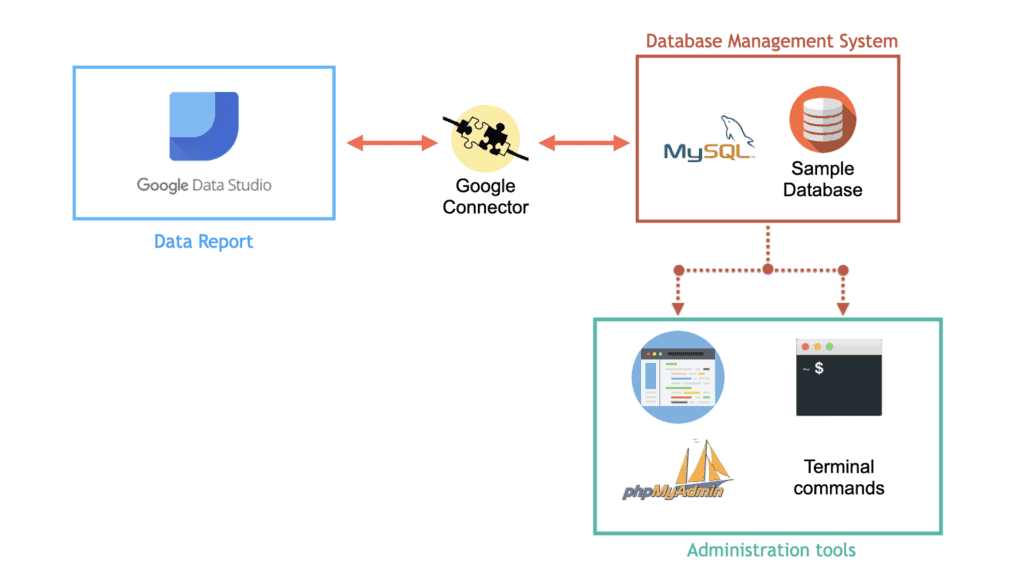
Before facing the exercises, it is important to have a clear idea of the general overview we are dealing with. Conceptually, the basic aspects are exactly the same of the ones described in the previous activity. If you observe Figure 1, our objective is to use the proper connector to link our data report with the information stored in the selected database. In this case, we will remotely connect Google Data Studio with the associated MySQL instance to import our data.
In general, the system users have the possibility to interact with the database according to their privileges. The native approach for MySQL is to use the specific commands through the available MySQL shell. However, this method might be less intuitive and tricky. For this reason, graphical interfaces have been proposed to support users in creating, editing and visualizing databases. One of the most popular ones is certainly the open source tool phpMyAdmin, written in PHP. It was designed for performing the database-related maintenance operations.
Addressing the problem
Data are a powerful source of general details and crucial information for companies. Imagine that a retailer of scale models of classic cars asked you to generate a useful report highlighting the major insights about the corresponding sales, customers and staff.
In order to carry out this activity, they have made their database available for further analysis through MySQL connection (for more information, you can visit https://www.mysqltutorial. org/mysql-sample-database.aspx). In Figure 2, you can observe the schema reporting all the tables to better understand the given scenario. Therefore, your job consists in preparing a comprehensive dashboard exploiting your Data Studio and SQL skills. So, let’s start!

TIP.
When you need to interact with a new database, it is suggested to spend some time analyzing the general schema to get familiar with the provided information and relationships.
Create the Google Data Studio report
As always, the preliminary stage consists in connecting to https://datastudio.google.com/ and performing the login if necessary. Once you have access to your personal page, create a new Blank report to begin.
Connection and authentication
The first automatic step is obviously to Add data to report. Among the Google Connectors, select MySQL. You will then asked for database authentication (use BASIC), as shown in Figure 3. Use your credentials (host name, port, database, username and password) to complete the form and press Authenticate at the bottom to connect. If the authentication is successful, a new section will appear showing the tables available for the selected database.

Tables selection
At this point, you can individually choose which table should be imported as data source from the corresponding list. This is helpful if you desire to investigate in your report any specific table using the Add button. However, the whole table is often unnecessary and inefficient to load. The smartest solution is then to exploit your SQL knowledge by defining the proper queries to simplify your work. To do that, click on Custom Query.
Load your first table
First of all, you should get familiar with retrieving data and the related SQL commands. By using the custom query option you left pending in previous section, prepare your report to meet the following company requirements.
Question 1.
It is important to have a general overview of the products on sale. Define the proper query to import the corresponding data from the products table. In particular, we are interested in productCode, productName, quantityInStock, buyPrice and MSRP only.
TIP.
You can easily verify the correctness of your query by taking a look to the right panel of the created table. Are the dimensions the expected ones?
Inspecting the data source in Google Data Studio
As we learned during the last tutorial, a common step is to explore the data source. In this case especially, it can be extremely useful. Select Resource from the top menu and Manage added data sources. Press the Edit action for your data source to obtain something similar to Figure 4.
Before any modification, you can press Edit Connection on the left. This allows you to change the previously defined query according to your needs. Clearly, most of the tasks can be reproduced directly in Data Studio, but it is interesting to observe how changing the query affects the report.
Then, you can select Reconnect and observe the pop-up message of Google Data Studio to recap the new configuration. If everything is correct, press Apply to conclude.

Question 2a.
Frequently, the final dashboard is expected to be shared with different people. Using the database column names as default may be indeed unclear. Update your SQL query to automatically rename all the selected dimensions other than MSRP.
Question 2b.
Rename the data source with a more appropriate name. Finally, change the type of buyPrice and MSRP to be more consistent in your visual representation (i.e. from number to US Dollar). Next, save your changes with Finished and return to the report with the Close button.
Company products in a nutshell
Since the products data have been correctly imported, we can present the associated information in our dashboard. Prepare the report with title, header and layout you prefer.
Question 3.
Create/update a table reporting the previous information about the available products. Use the right-side panel to select all the filtered dimensions (productCode, productName, quantityInStock, buyPrice, MSRP). The company wants the list about the models ordered by quantity in stock (showing at least the top 5 elements).
Payments and profit
Moving on to the other tables, we should include additional data sources. There are two methods: you can select Add data from the top menu as usual or you can Duplicate existing data sources from the Manage added data sources menu and change the desired query. The latter one avoids to fill in the form each time, but it is strongly not recommended due to performance issue.
Question 4a.
Try to import the payments table as separate data source using the custom query. How should you write the command to import all the columns? Observe the dimensions if they need some additional change.
Question 4b.
Create a specific box to summarize general performance indicators. Place a Scorecard reporting the total amount of received payments in US dollars (i.e. sum) supported by a bar chart showing the top 3 dates with higher amount (use the style section to choose the bars number). Can you spot which period of the year is the most beneficial?
TIP.
Remember to rename the new data source, otherwise they are all assigned to the same default name!
We have successfully completed all the preliminary operations and our final dashboard is now reporting some first interesting information. However, additional analysis should be performed to highlight other significant trends. In the second part of the tutorial, we will conclude the sales report by including the missing aspects.


One Response