Data are a key resource in any business. Analyzing them allows us to understand, for example, whether our business is progressing properly or whether we need to adapt new strategies. There are several tools for saving and analyzing data, but many of them also require some level of computer expertise. One method that can be useful to everyone is to use the free Google services both to store data and to analyze and visualize it. In this article, therefore, we will use Google Spreadsheets both to store raw data and to visualize aggregated data using BigQuery without having to upload CSV files or use paid third-party services.
What are Google Spreadsheets
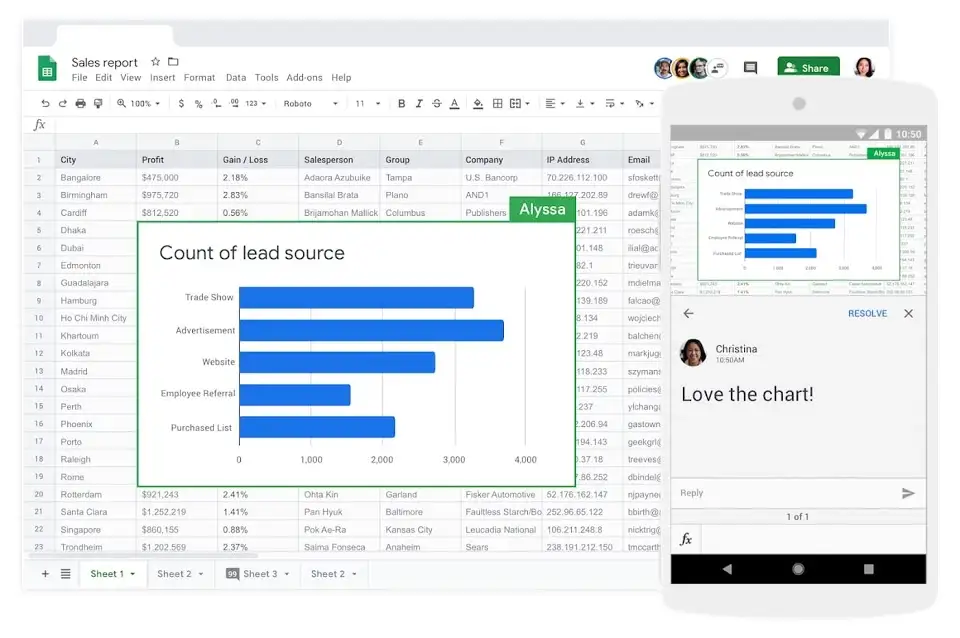
It is hard to find anyone who does not work with Google Cloud platform products, and who does not use Google Spreadsheets in one way or another. The service is free and is very convenient to use, with many built-in functions and formulas. In addition, it is easy to use to collaborate with other users/colleagues anywhere, anytime.
Useful Resources
- Get started with Google Sheets tutorial
- Google Forms Tutorial For Beginners playlist
- Google Sheets Intermediate tutorial
- Google Sheets Advanced tutorial
- Google Sheets — Tips and Tricks
When should a data warehouse be used?
Due to its advantages, Google spreadsheets are simply indispensable in the work of data collection and analysis for small/medium enterprises. If the information to be analyzed is not much and is required by only a few people, it is difficult to choose a service that is more convenient for the job.
However, when the company or business grows, data volumes (including the use of data from different sources) increase accordingly. At that time, some restrictions in working with spreadsheets begin to appear. At this point, you need to plug in a data warehouse such as Google BigQuery.
What is Google BigQuery?
Google BigQuery cloud storage allows you to collect data from multiple sources, process it in seconds using SQL queries, and create reports with any metric without sampling or restrictions.
It is one of the most popular cloud-based services and certainly one of the most affordable. Why Google and not other cloud services? Because Google is one of the giants in the market, and the integrated storage offered by BigQuery represents a seamless and native integration among the cloud services offered by the BigMountain giant. Simply put, there is no need to waste time finding connectors, but everything works immediately.
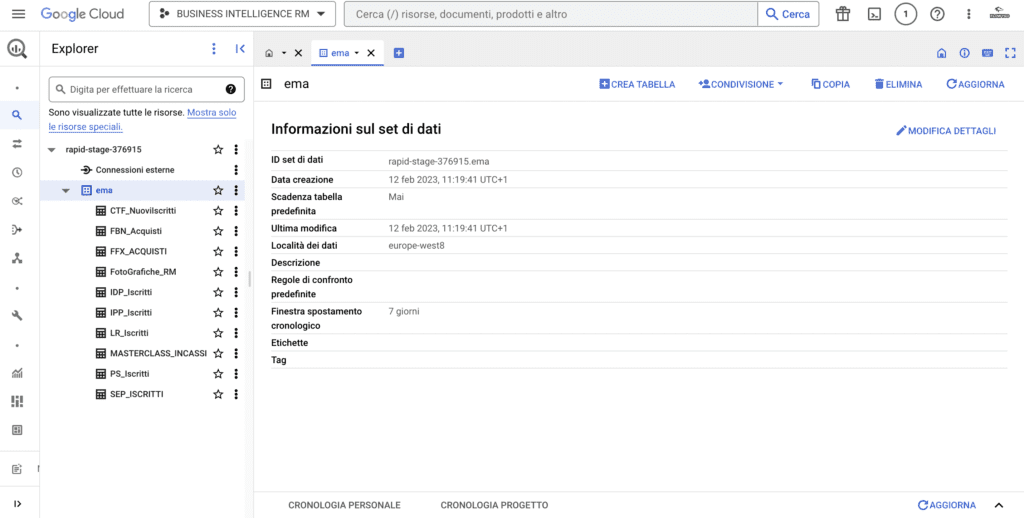
There are also other advantages to using BigQuery as a data warehouse, including:
- speed and simplicity
- ongoing developer support and development
- ready-to-use sets of SQL queries
- built-in machine learning (ML) and artificial intelligence (AI)
- no configuration required for servers and services
Before you can load data from BigQuery into your spreadsheets, you must collect and merge it into a data warehouse. In BigQuery you can create the tables from different sources, such as spreadsheets. However, if you are not familiar with the Google Cloud console and its interfaces, we recommend using OWOX BI for this task.
How to move data from Google Sheets to BigQuery
If you want to use all the analysis features, sooner or later you will have to move information from Google Sheets to the data warehouse. For example, you can upload offline order statistics to cloud storage to build a ROPO analysis. Let’s see, then, how to download the necessary information quickly and easily.
Using the OWOX BI Addon
7 reasons to choose the OWOX BI addon as a connector from BigQuery to SpreadSheets/ SpreadSheets to BigQuery.
- The addon is completely free, you only pay for data processing in BigQuery.
- You can quickly create reports and charts with any amount of data directly in Google tables.
- You can configure reports to be automatically updated as often as you wish.
- A convenient query editor with autosuggest saves time when creating a report. In addition, you can specify dynamic parameters in a query that can be used even by those unfamiliar with SQL.
- It will be convenient to share reports with colleagues: just allow them access to the document. Users who have access to your project in GBQ will be able to manage the queries used in the report. At the same time, you can check the change history of each query.
- The addon works in both directions, which means you can also send data from Sheets to GBQ.
- It is safe and secure. We use only the official Google API. All data is transferred to your Cloud Platform project whose access you can control.
How to transfer data from Google Sheets to Google BigQuery.
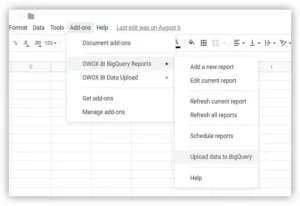
Install the OWOX BI addon in your Chrome browser. Go to your data table and select OWOX BI BigQuery Reports – Upload data to BigQuery:
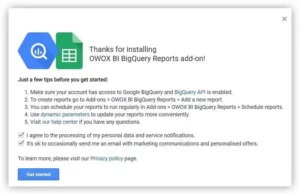
If you are working with this addon for the first time, you need to provide access to BigQuery.
A window opens in which you must select the project and dataset in GBQ and find a name for the table into which you want to load the data. Then select the boxes for the fields whose values you want to import. All fields are automatically “STRING,” but you may want to replace the types with those that match the field contents. For example, for numeric identifiers the type is “INTEGER,” for prices the type is “FLOAT,” etc. Be careful, however, not to mix data of different types within the same column to avoid not being able to later query the data due to conversion errors.
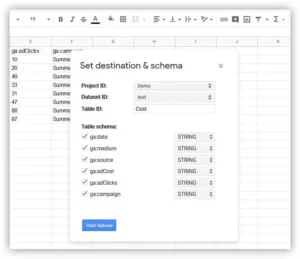
Click Start Loading and the statistics will be uploaded to Google BigQuery.
Using the BigQuery data connector
Google has updated the Google Sheets data connector, now called Connected Sheets. It allows you to create queries and analyze datasets using spreadsheet tools and operations.
Important! To use the new connector, you must upgrade your account. This native connector is not available to all users, but only to customers who have purchased G Suite Enterprise and G Suite Enterprise for Education.
To download the necessary data from BigQuery, you must:
- Open the spreadsheet you are working with
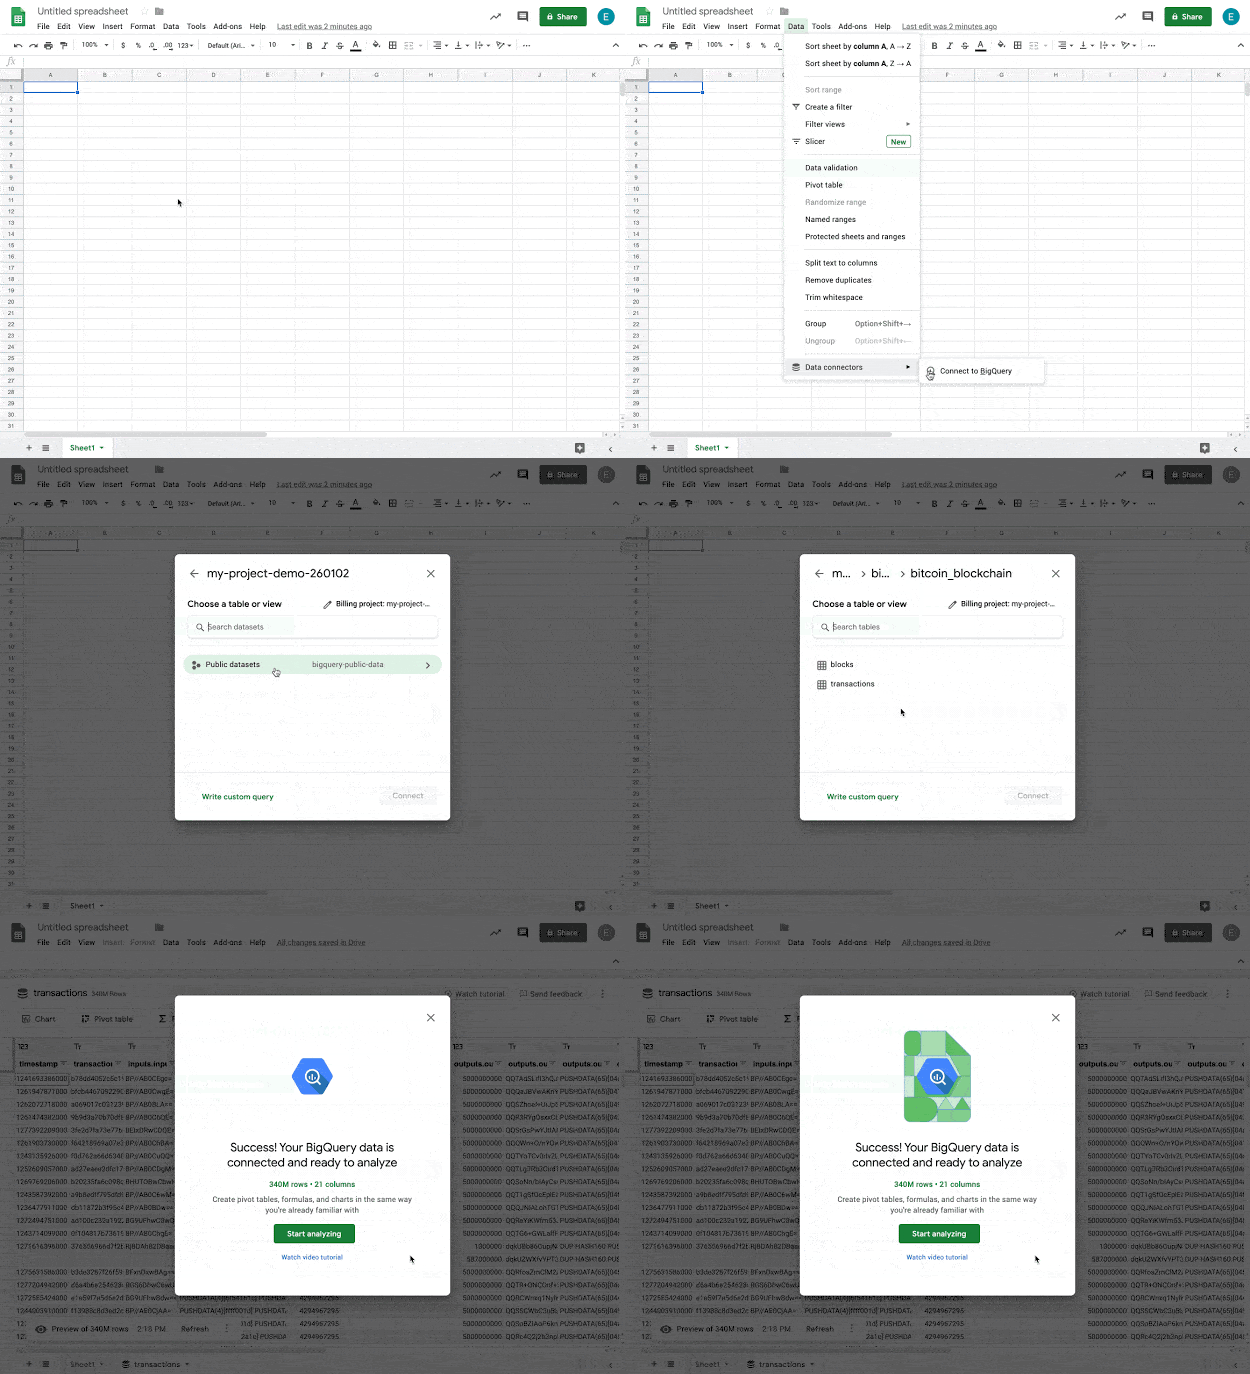
- Click on the Data menu, choose the Data Connectors item, and click Connect to BigQuery
- Choose the project and table from which you want to get the data
- Download the data set by clicking Connect and then click Start Analysis
Useful Resources
How to automatically download data from BigQuery to Google Sheets
Using the OWOX BI addon
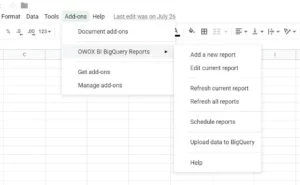
Open the table and select OWOX BI BigQuery Reports – Add a new report:
Then, in the right sidebar, specify the GBQ project you want to display in the report. If you have already created the SQL query you want to include in the report, select it from the list. Otherwise, if you want to edit the query, click Edit and edit the text.
For this purpose, you can use the automatic suggestion in the Query Editor, which offers syntax highlighting, automatic additions, versioning, query validation, and a preliminary estimate of the amount of data processed:
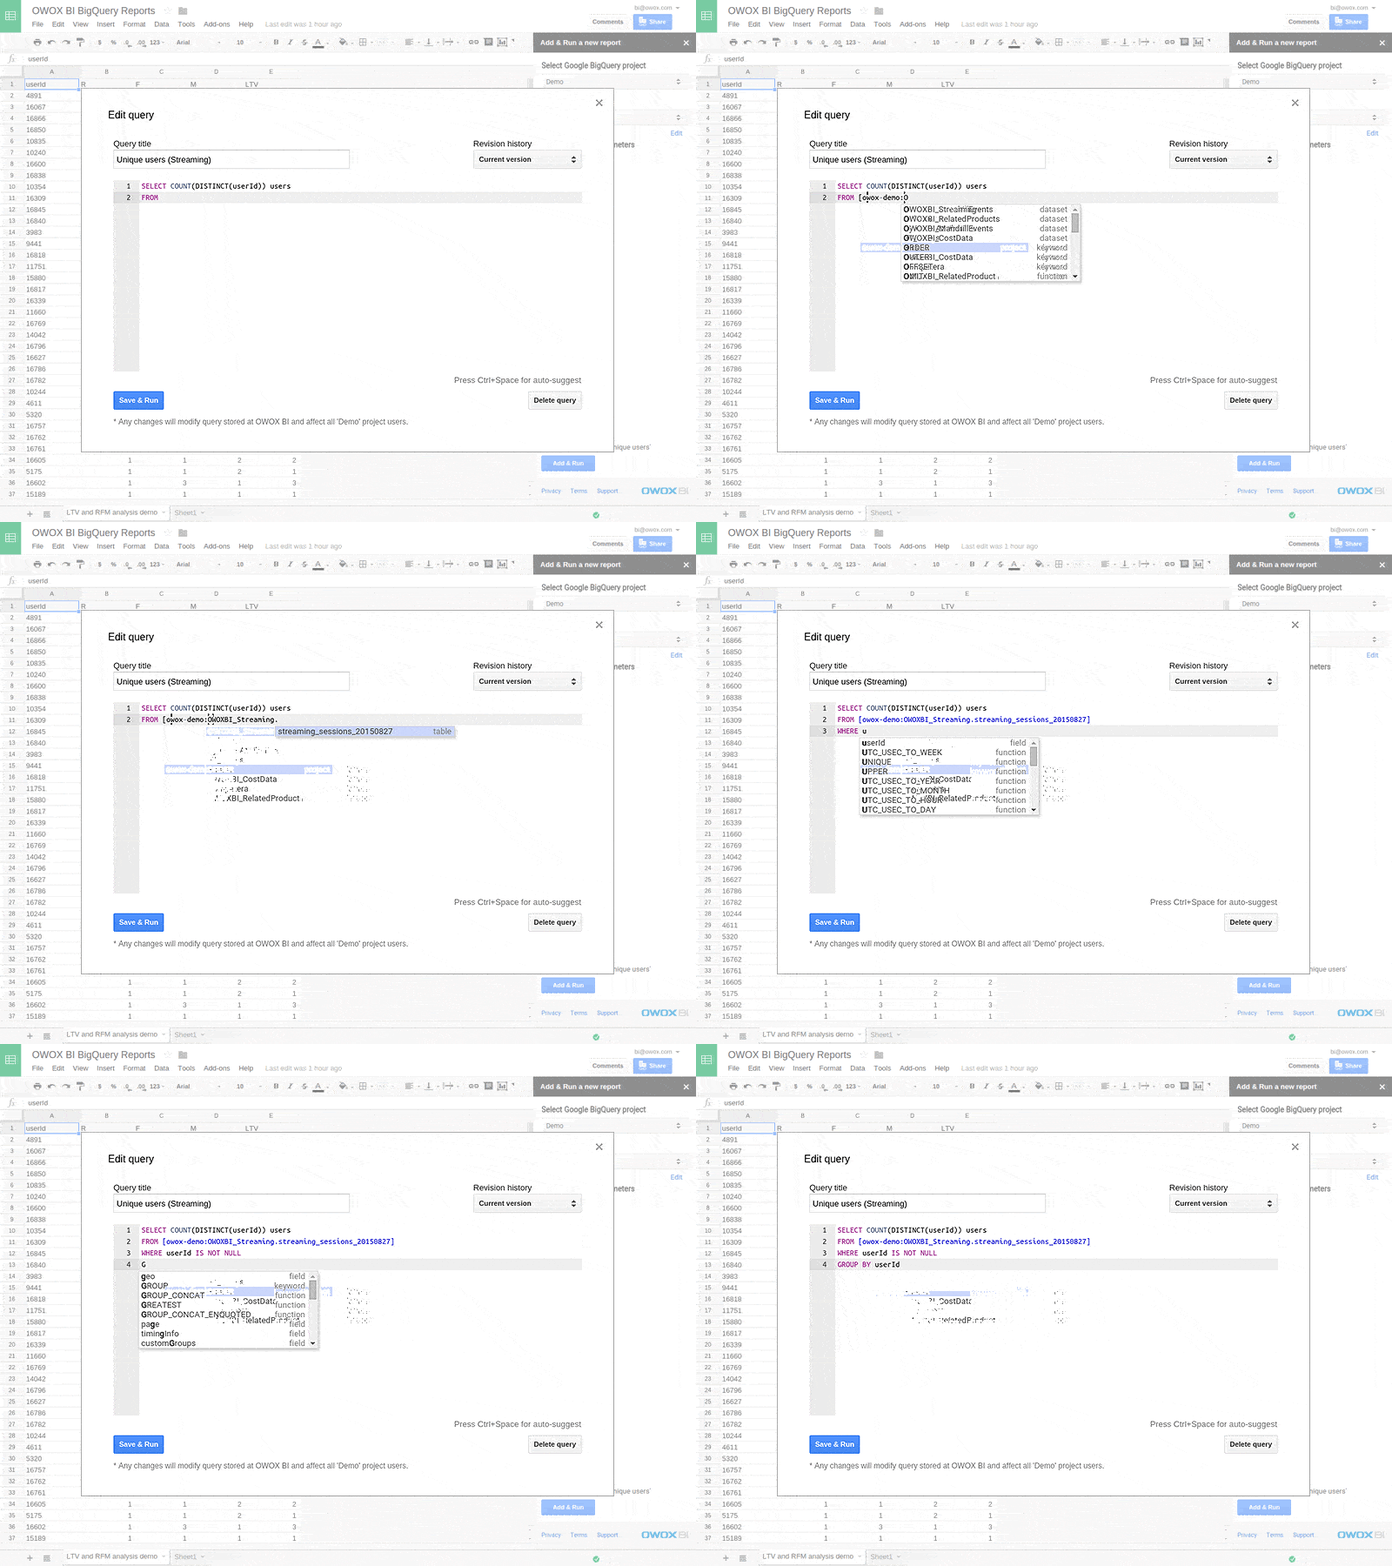
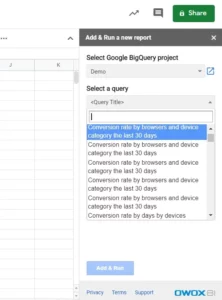
If you want to create a new query, scroll down the list of queries to the end and click on the Add New Query line, enter the text, and click Save and Execute:
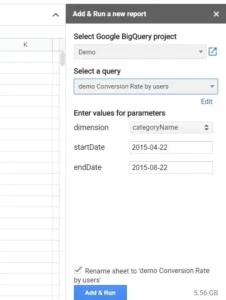
Select dynamic parameters if they were specified in the SQL query. In our example, in the screenshot below, the parameters are the reporting period and the category name. Start the query by clicking Add and Execute:
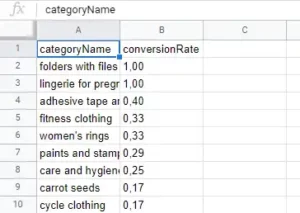
The data is then processed in BigQuery and the result of the query is automatically imported into Sheets in a separate sheet:
Next, you can display the desired information to create pivot tables, charts, graphs and so on.
Schedule automatic report updates in Google Sheets
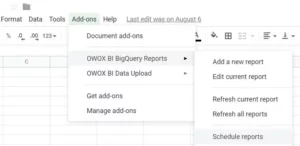
With the OWOX BI addon, it is possible to enable scheduled query execution to avoid manually running calculations every time we want to analyze them. To do this, open the required report and select OWOX BI BigQuery Reports – Schedule reports from the Add-Ons tab:
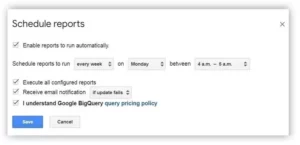
Specify the frequency of updating statistics in the report (hour, day, week, or month) and set the time when the query is run. If you wish to receive an e-mail alert when the report is updated, check the corresponding box. At this point save the settings.
Conclusions
If you want to use advanced analytics, use raw data to create reports and measure the efficiency of your business or din some project, we recommend using Google BigQuery. Combine the functions of this service with Google Sheets and make the most of both Google products.
Now you know how to transfer data from Google BigQuery cloud storage to Google Sheets and vice versa. With the help of the OWOX BI BigQuery Reports addon, you can easily perform cohort analysis, segment users, and create many other useful reports.
