Pandas is the most widely used library for reading, writing and analyzing in Python. Due to its simplicity and similarity to other data analysis software (e.g. Matlab), even less experienced users in programming find this library very useful. Therefore, it is not uncommon to see data scientist projects using pandas for some analysis.
Although there is excellent community support and continuous updating, data visualization is always left up to the developer. Pandas provides the ability to graph data in different formats, but you have to write the code on purpose and proceed by trial and error.
Over the years, libraries have been developed to integrate the visualizations provided in pandas with click navigation. In this way, even the novice user can “play” with the data in a simple and intuitive way. Among these libraries we mention Bamboolib and PandasGUI.
Bamboolib is very professional and easy to use, but it is only available for free to students, researchers and industry enthusiasts. If you are a company and/or you need to integrate plugins as well, then you will have to pay a fee that will be calculated according to your needs.
In this article we analyze a competitor: PandaGUI. Less professional, but definitely effective for tracking and redrawing pandas dataframes. In fact, the user has the freedom to perform custom operations. Let’s see below its various features and functionalities that may come in handy when analyzing your data.
Installation
PandasGUI is a GUI for analyzing Pandas dataframes. The project is still under active development and therefore subject to change. PandasGUI comes with many useful features, which we will cover in detail later in the article. Before that, let’s see how we can install the library and make it work.
Before installing the library we recommend that you create your own development environment. To do this you can simply use pipenv. This way you will install only the libraries you need for your project in a dedicated workspace and not at the operating system level. Therefore after you have created your workspace with pipenv shell, you can proceed with the installation of PandasGUI. The commands are as follows.
# from PyPi
pip install pandasgui

# from Github
pip install git+https://github.com/adamerose/pandasgui.git
The various dependencies should be installed automatically, but in case you encounter errors when importing the library you will have to install the missing libraries.
With the library are also provided some example datasets with which you can begin to familiarize yourself with the interface. Obviously you can read any csv file to import your own data. The datasets provided are the following
- datasets csv
- pokemon
- car_crashes
- iris
- mpg
- penguins
- tips
- titanic
- gapminder
- stockdata
- trump_tweets
- mi_manufacturing
- Computed datasets
- simple
- multiindex
- small
- unhashable
In this article we will use the Pokemon dataset. To import the data it will be enough to indicate in the initial import which datasets we want to use. For our tutorial the commands are as follows.
import pandas as pd
from pandasgui import show
from pandasgui.datasets import pokemon
At this point we can launch the GUI.
gui = show(pokemon) Otherwise if you want to use your own dataset, you have to create a dataframe in pandas reading from a csv file with the following commands.
dataset = pd.read_csv('dataset.csv')
gui = show(dataset)
Once the commands just described have been executed, a separate window opens displaying the loaded dataframe.

Let’s analyze the various functionalities offered by this tool.
Functionalities
Visualization and sorting
The left side of the screen shows the size of the imported dataset. In the case of the Pokemon dataset we have 800 rows and 13 columns.
You can quickly sort the data in ascending or descending order by simply clicking on the column header.
Filtering
In addition to displaying the entire dataframe, you can filter the data using query expressions that use the Dataframe.query() method. The filters must be written as Boolean expressions. For example if we want to filter Pokemon by their type we can write.
Type1 == 'Grass' Once you click on the “Add filter” button, the dataframe is updated displaying only the records that satisfy the Boolean expression. It is possible to add an arbitrary number of filters and disable them if necessary. Leaving the “Autocomplete” flag set, the tool provides the suggestion for the name of the field on which to set the filter.
Data editing
Another feature of this tool is the ability to directly edit any value within cells. By double clicking on the cell of interest you can start editing the corresponding value. You can also copy and paste the selected data into another environment such as excel or notepad.
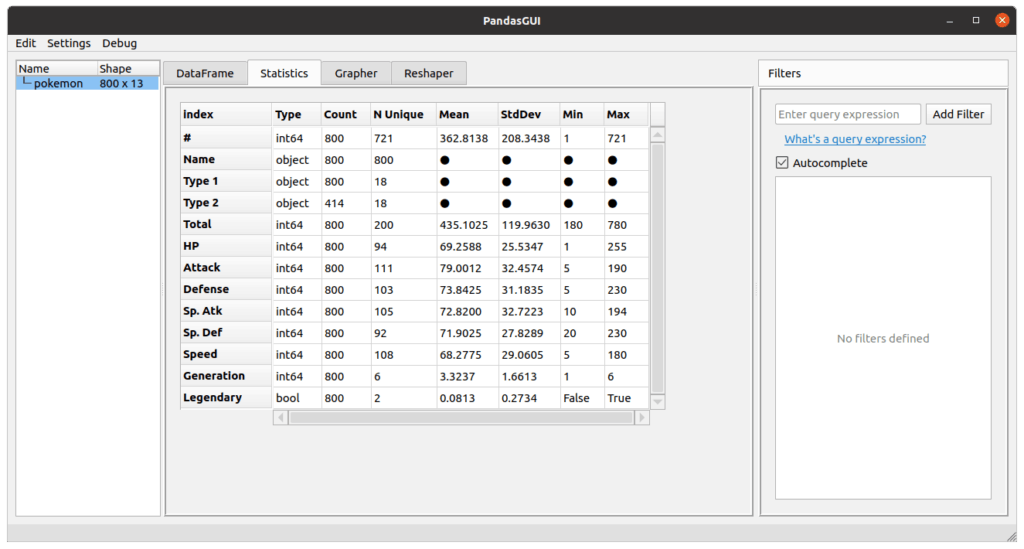
Statistics
PandasGUI also calculates some statistics about the data distribution. For each column of the dataframe it provides the type of data, the number of records for which a value is defined and the number of unique values. If the data type allows it, it also provides the average, the standard deviation and the minimum and maximum values.
If one or more filters have been applied, the statistics are updated accordingly.
Interactive plotting
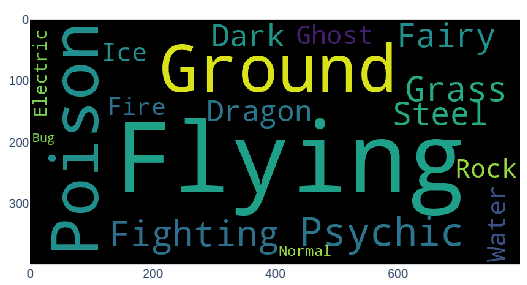
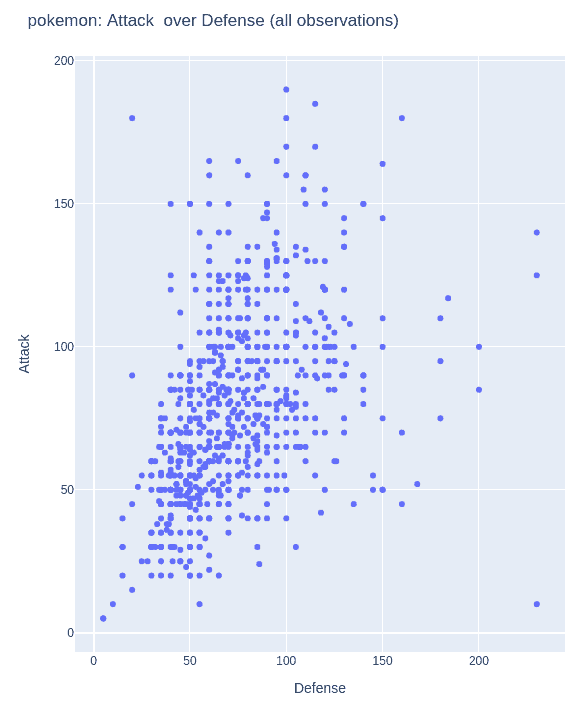
Data visualization is an essential part of any data analysis process. PandasGUI provides several options to quickly create some interactive charts.

For example, we can have a Word cloud of Pokemon types, or display a scatter plot of attack and defense values. Depending on the type of chart we are asked to set on which fields the visualization should be done. Simply by using drag & drop of the columns in the appropriate fields, the tool draws the required graph.
Finally it is possible to save the result both as HTML code and as code to import it in our project. Below are some charts created using the interactive interface.
DataFrames reshape with pivot and melt functions
Sometimes you need to reshape the data to get a more aggregated view. PandasGUI provides two functions – pivot and melt – to achieve the same result. Using the drag & drop feature here as well, you can set parameters to aggregate the data appropriately.
Quick data import
Another interesting feature of the tool is that you can simply import a dataframe by dragging it to the left side of the interface.
Jupyter Notebook Integration
If you have directly imported a dataframe into the PandasGUI interface, you can also access the same in the familiar juptyer notebook, with just a few lines of code. From there, you can bring the data analysis process into the notebook itself, if you wish.

Conclusions
Pandas is a great tool to analyze data in a simple and effective way. Through the PandasGUI library it is possible to analyze the data of our interest in a simple, intuitive and fast way. Not needing great programming skills, it can be a useful tool for those who want to approach the world of data analysis.
We also leave you the tutorial video of the library if you are interested in seeing the features shown above in action.


