In articles Kibana: let’s explore data we saw the main features of Kibana and some potential of the data visualization and search methods offered by the tool. Therefore, the time has come to try creating our own dashboard with our data. In this tutorial we will see how to define indexes and their mapping, upload data to Elasticsearch via the bulk API and finally create multiple visualization panels to compose a dashboard.
Load a dataset in Elasticsearch
This tutorial requires three datasets:
- The complete works of William Shakespeare, conveniently divided into fields. Download shakespeare_6.0.json.zip
- A set of dummy accounts with randomly generated data. Download accounts.json.zip
- A set of randomly generated log files. Download logs.jsonl.zip
First you have to unzip the downloaded files.
Structure of datasets
The Shakespeare dataset has the following this structure:
{
    "line_id": INT,
    "play_name": "String",
    "speech_number": INT,
    "line_number": "String",
    "speaker": "String",
    "text_entry": "String",
}
The accounts dataset is structured as follows:
{
    "account_number": INT,
    "balance": INT,
    "firstname": "String",
    "lastname": "String",
    "age": INT,
    "gender": "M or F",
    "address": "String",
    "employer": "String",
    "email": "String",
    "city": "String",
    "state": "String"
}
The logs dataset has dozens of different fields. Here are the noteworthy fields for this tutorial:
{
    "memory": INT,
    "geo.coordinates": "geo_point"
    "@timestamp": "date"
}
Set up mappings
Before loading the Shakespeare and log datasets, you must set up mappings for the fields. The mappings divide the documents in the index into logical groups and specify characteristics of the fields. These characteristics include whether the field is searchable and whether it is tokenized, or split into separate words.
In Kibana Dev Tools > Console, set up a mapping for the Shakespeare dataset:
PUT /shakespeare
{
 "mappings": {
  "properties": {
    "speaker": {"type": "keyword"},
    "play_name": {"type": "keyword"},
    "line_id": {"type": "integer"},
    "speech_number": {"type": "integer"}
  }
 }
}
This mapping specifies the field characteristics for the dataset:
- The speaker and play_name fields are keyword fields. These fields are not parsed. Strings are treated as a single unit even if they contain multiple words.
- The line_id and speech_number fields are integers.
The log dataset requires a mapping to label latitude and longitude pairs as geographic locations by applying the geo_point type.
PUT /logstash-2015.05.18
{
  "mappings": {
    "properties": {
      "geo": {
        "properties": {
          "coordinates": {
            "type": "geo_point"
          }
        }
      }
    }
  }
}

PUT /logstash-2015.05.19
{
  "mappings": {
    "properties": {
      "geo": {
        "properties": {
          "coordinates": {
            "type": "geo_point"
          }
        }
      }
    }
  }
}

PUT /logstash-2015.05.20
{
  "mappings": {
    "properties": {
      "geo": {
        "properties": {
          "coordinates": {
            "type": "geo_point"
          }
        }
      }
    }
  }
}
The accounts dataset does not require any mapping.
Load datasets
At this point, you are ready to use Elasticsearch’s bulk API to load the datasets:
curl --user elastic:changeme -H 'Content-Type: application/x-ndjson' -XPOST 'localhost:9200/bank/account/_bulk' --data-binary @accounts.json
curl --user elastic:changeme -H 'Content-Type: application/x-ndjson' -XPOST 'localhost:9200/shakespeare/_bulk' --data-binary @shakespeare_6.0.json
curl --user elastic:changeme -H 'Content-Type: application/x-ndjson' -XPOST 'localhost:9200/_bulk' --data-binary @logs.jsonl
These commands may take some time to execute, depending on available computing resources.
Verify that loading was successful:
GET /_cat/indices?v Define index patterns
Index patterns tell Kibana which Elasticsearch indexes you want to explore. An index pattern can match the name of a single index, or include a wildcard (*) to match multiple indexes.
For example, Logstash typically creates a set of indexes in the format logstash-YYYY.MMM.DD. To explore all the log data for May 2018, you could specify the index pattern logstash-2018.05*.
You will create patterns for the Shakespeare dataset, which has an index named shakespeare, and the accounts dataset, which has an index named bank. These datasets do not contain time series data.
- In Kibana, open Stack Management and then click Index Patterns.
- If this is your first index pattern, the Create index pattern page opens automatically. Otherwise, click
 on the top left corner.
 - Enter shakes* in the Index pattern field.
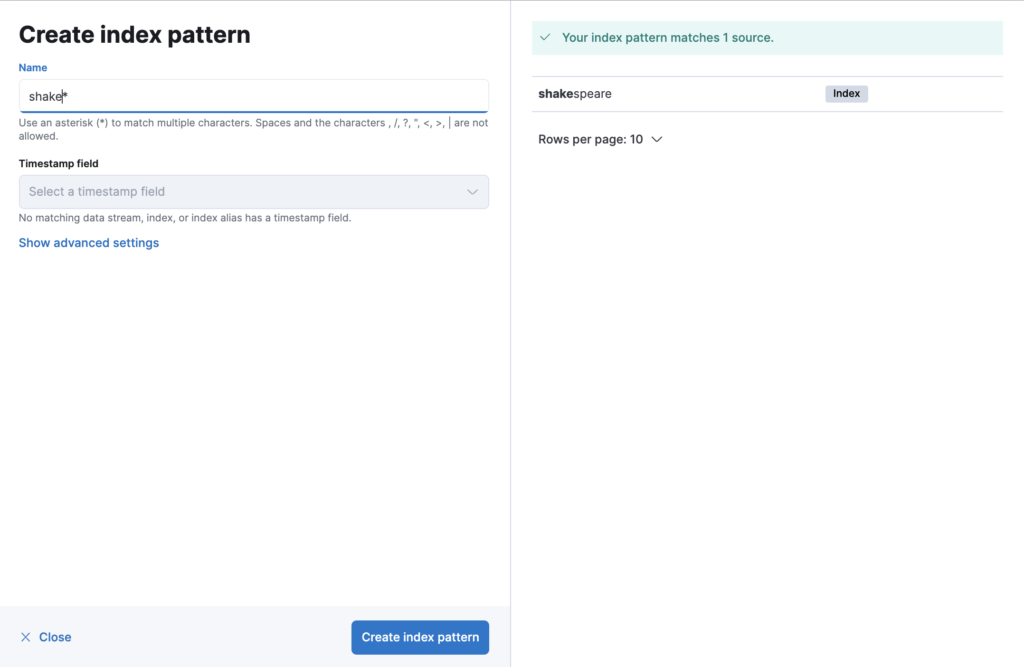
- Click
 . For this pattern, you do not need to configure any settings.
 - Define a second index pattern called ba* You do not need to configure any settings for this pattern.
- Now create an index model for the Logstash dataset. This dataset contains time series data.
- Define an index pattern called logstash*.
- Select @timestamp in the Timestamp drop-down menu.
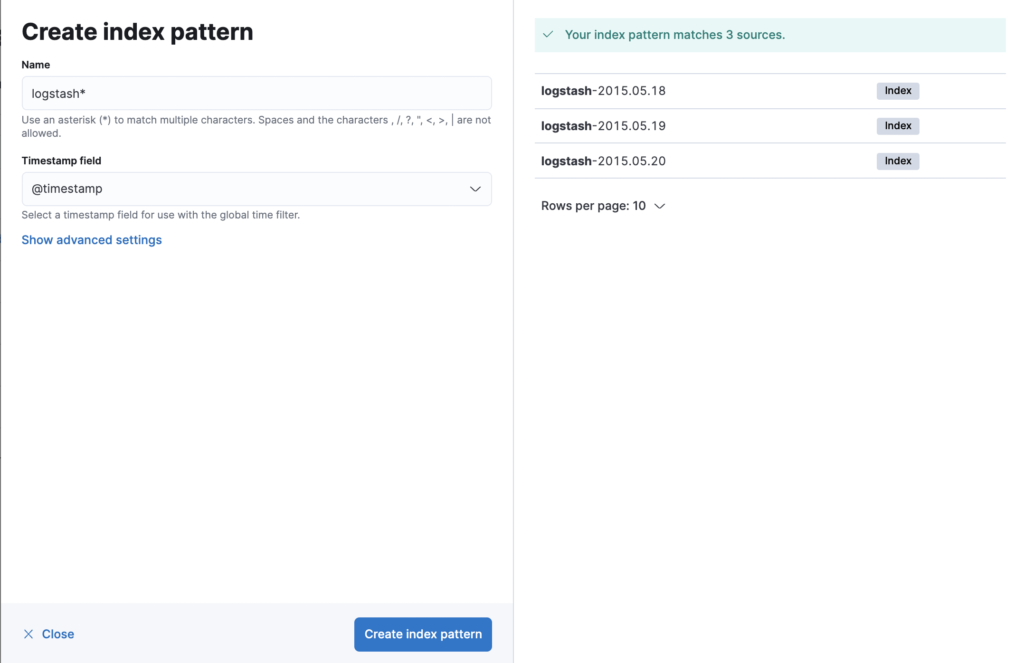
Discover and explore data
Using the Discover app, you can enter an Elasticsearch query to search your data and filter the results.
- Open Discover.
- The current index pattern appears under the filter bar, in this case shake*. You may need to click on New in the menu bar to update the data.
- Click on the cursor to the right of the current index pattern and select ba*. In the search field, enter the following string:
account_number<= 100 and balance >= 47500 - Click

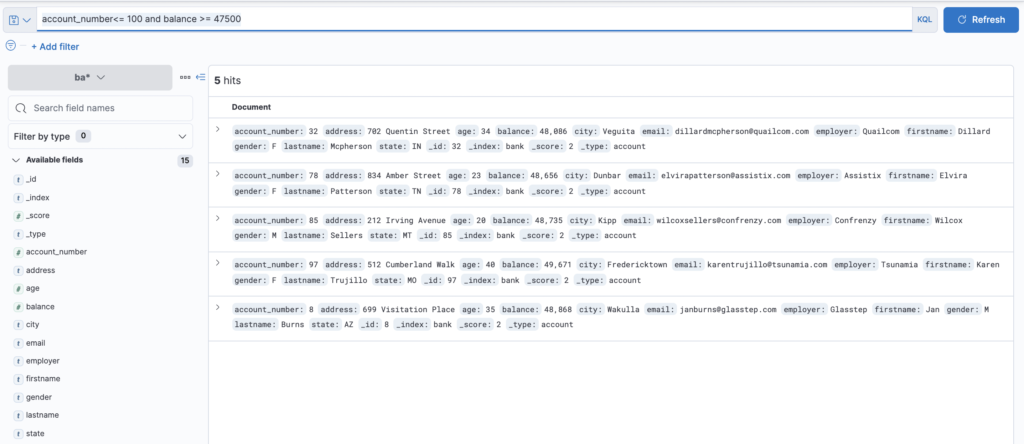
By default, all fields are shown for each corresponding document. To choose which fields to display, hover over the list of Available Fields and then click add next to each field you want to include as a column in the table.
For example, if you add the account_number field, the display changes to a list of five account numbers.

Visualize data
In the Visualize app, you can shape your data using a variety of charts, tables and maps, and more. You’ll create four visualizations: a pie chart, a bar chart, a map, and a Markdown widget.
- Open Visualize Library
- Click
 . You will see all types of visualization in Kibana.
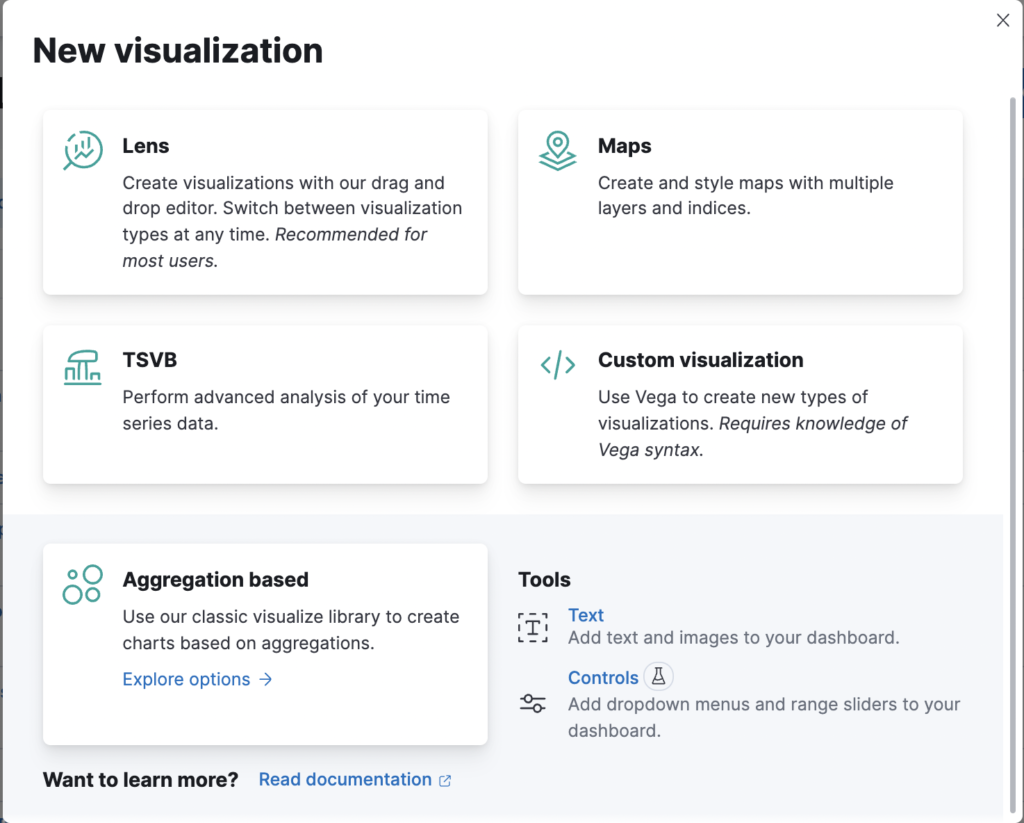
- Click Aggregation based
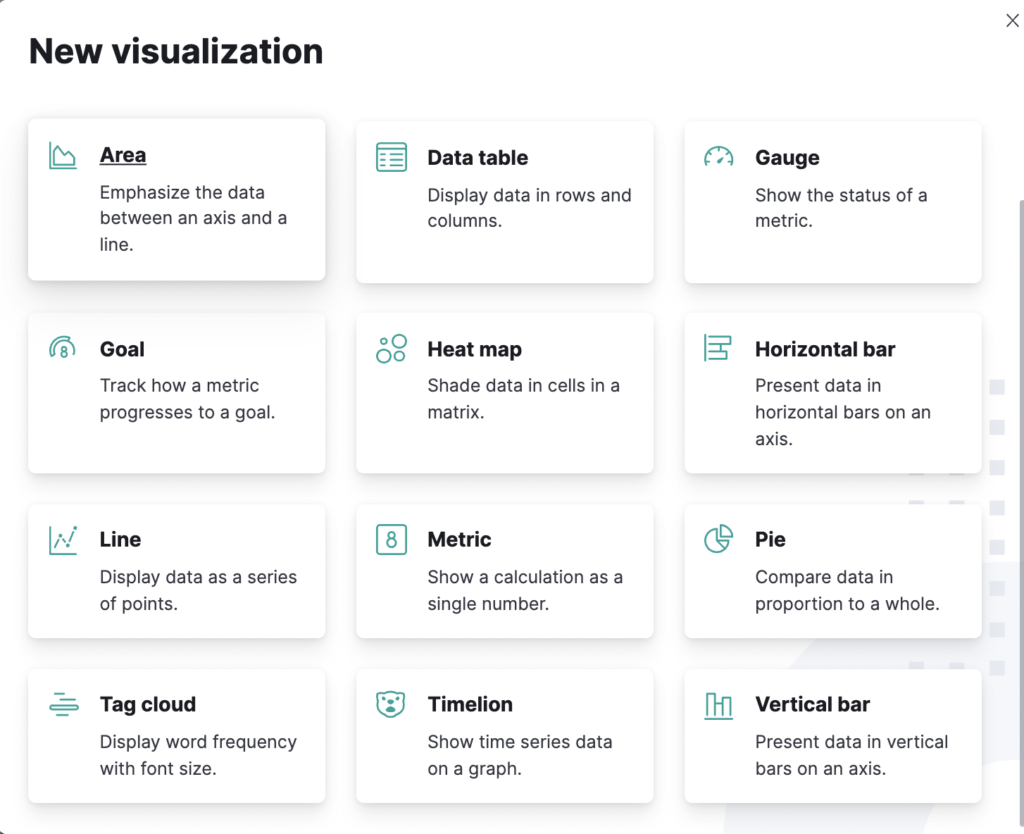
- Click Pie
- In New Search, select the index pattern ba*. You will use the pie chart to get an idea of account balances.
Pie chart
Initially, the pie contains only one “slice”. This is because the default search matches all documents.
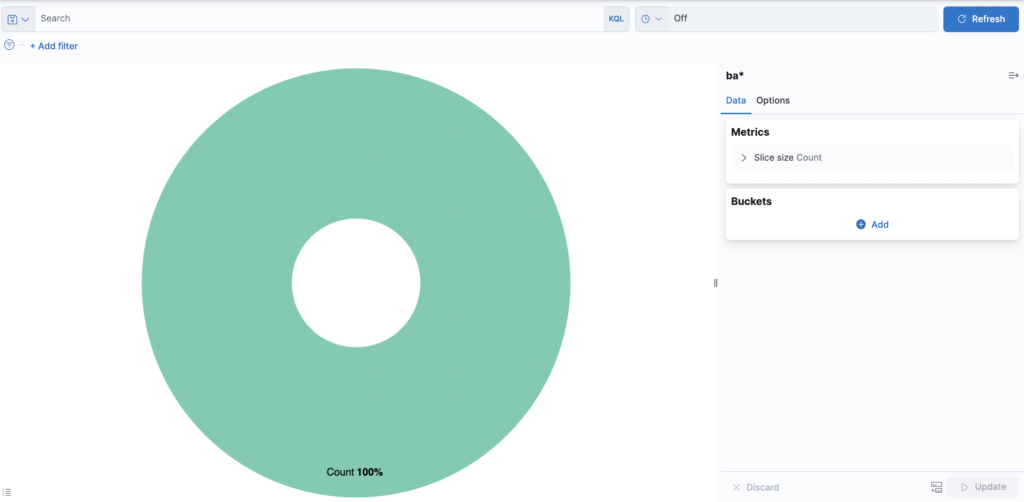
To specify which slices to display in the pie, you use an Elasticsearch bucket aggregation. This aggregation sorts the documents that match your search criteria into different categories, also known as buckets.
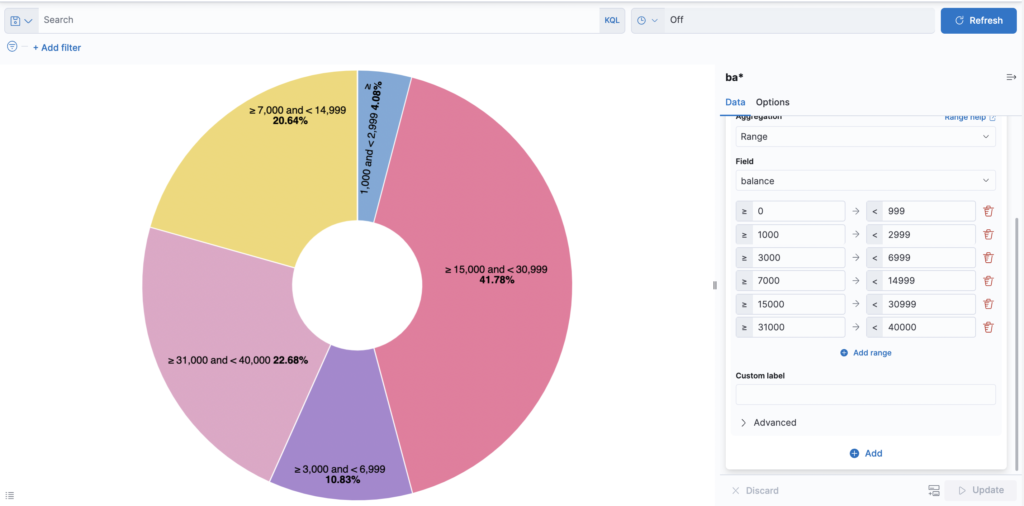
Use a bucket aggregation to establish multiple ranges of account balances and find out how many accounts fall into each range.
- In the Buckets panel, click Add and then Split Slices.
- In the Aggregation drop-down menu, select Range.
- In the Field drop-down menu, select balance.
- Click Add Range four times to bring the total number of ranges to six.
- Define the following intervals:
0             999
1000         2999
3000         6999
7000        14999
15000       30999
31000 50000 - Click

Now you can see what proportion of the 1000 accounts fall within each budget range.
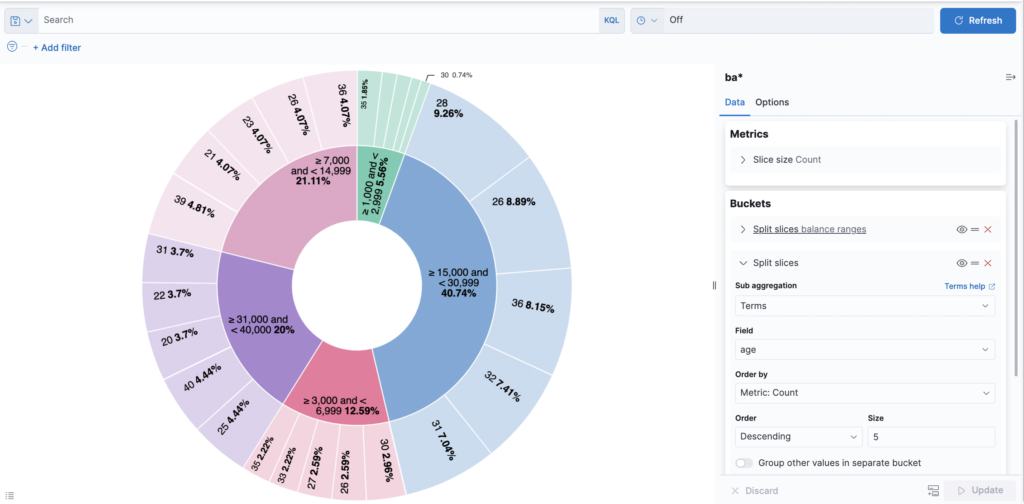
Add another bucket aggregation that looks at the age of the account holders.
- At the bottom of the Buckets panel, click Add.
- In Select buckets type, click Split Slices.
- In the Sub Aggregation drop-down menu, select Terms.
- In the Field drop-down menu, select age.
- Click
 .
.
Now you can see the age breakdown of the account holders, displayed in a ring around the budget ranges.
To save this chart
- Click on Save in the menu bar at the top and enter Pie Example
- Select None from the Add to dashboard options
- Click

Bar chart
You will use a bar graph to look at Shakespeare’s data set and compare the number of spoken parts in the plays.
Create a Vertical Bar graph and set the search origin to shakes*.
Initially, the graph contains a single bar showing the total count of documents that match the default query.
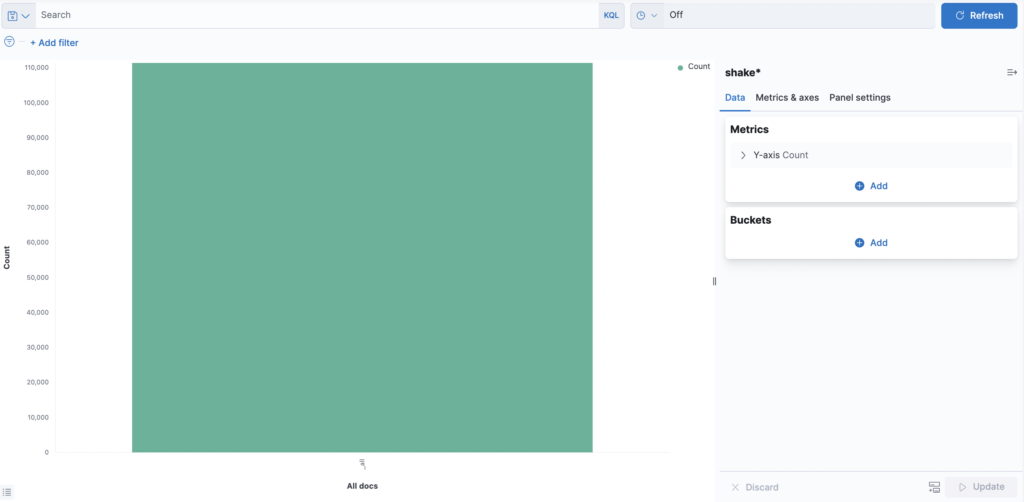
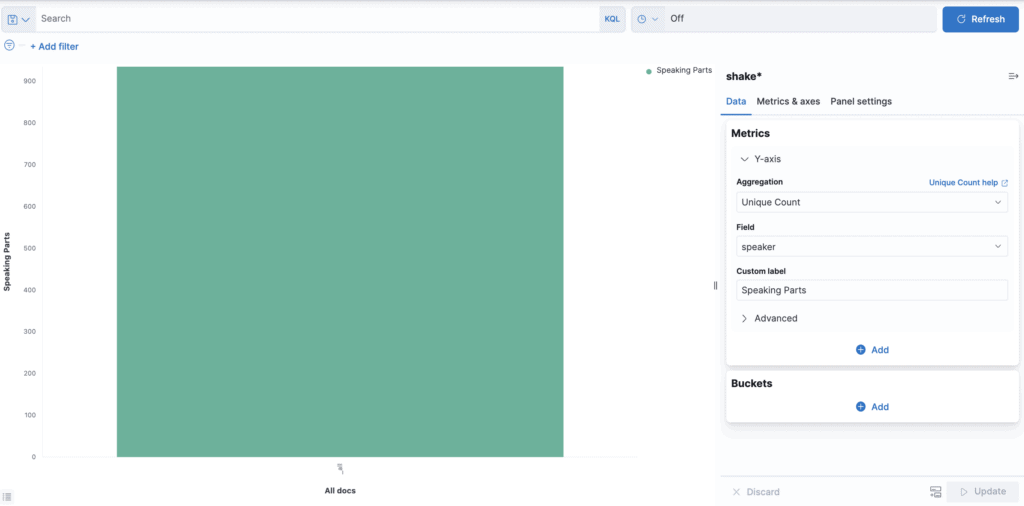
Display the number of spoken parts per show along the Y axis. This requires configuring metrics aggregation on the Y-axis. This aggregation calculates the metrics based on the values of the search results.
- In the Metrics panel, expand Y-Axis
- Set Aggregation to Unique Count
- Set Field to speaker
- In the Custom Label box, enter Speaking Parts
- Click

View the plays along the X-axis.
- In the Buckets panel, click Add and then X-Axis.
- Set Aggregation to Terms and Field to play_name.
- To list the plays in alphabetical order, in the Order drop-down menu, select Ascending.
- Give the axis a custom label, Play Name.
- Click

Hovering over a bar displays a tooltip with the number of spoken parts for that work.
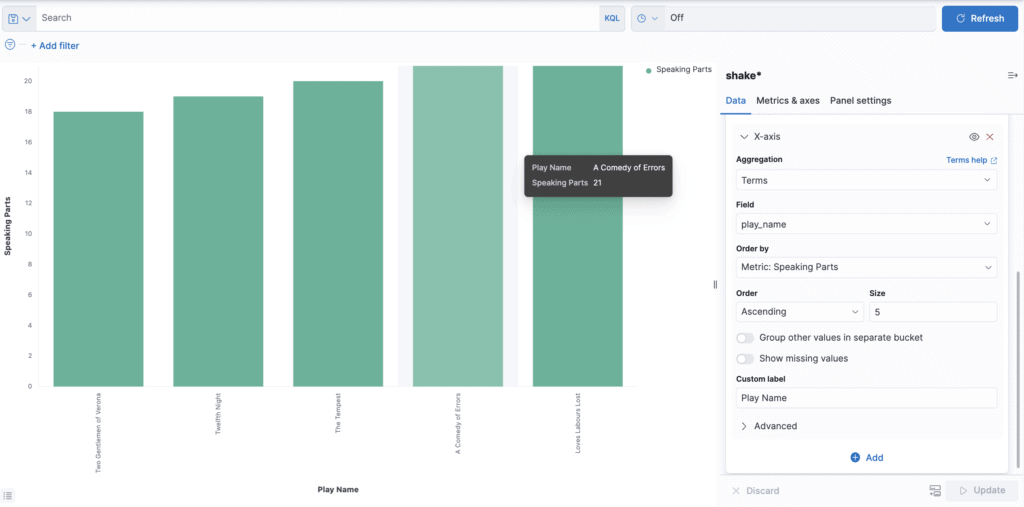
Notice how the individual play names appear as whole sentences, instead of broken into individual words. This is the result of the mapping you did at the beginning of the tutorial, when you marked the play_name field as unscanned.
To save this chart
- Click on Save in the top menu bar and enter Bar Example
- Select None from the Add to dashboard options
- Click

Map
Using a map, you can view the geographic information in the sample data in the log file.
- From the visualization types select Map
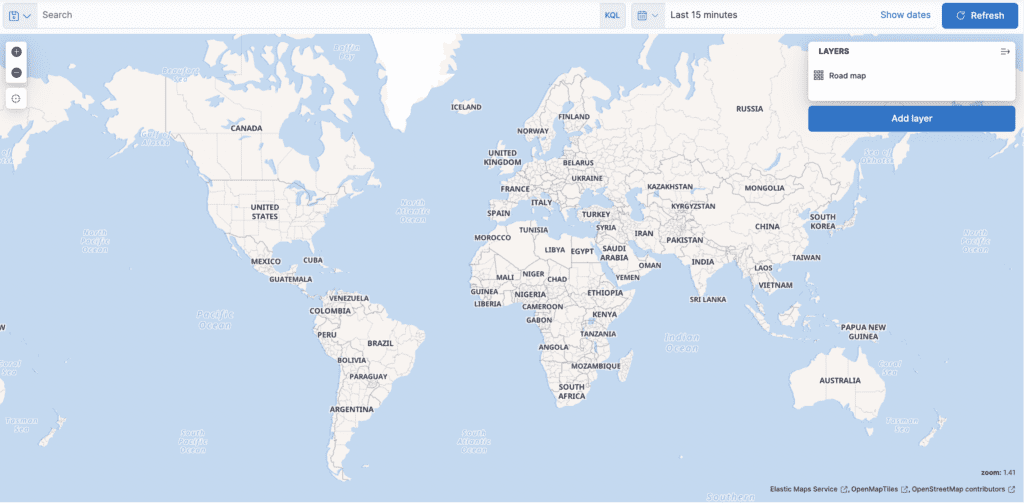
- Click Add layer
- Select Heat map
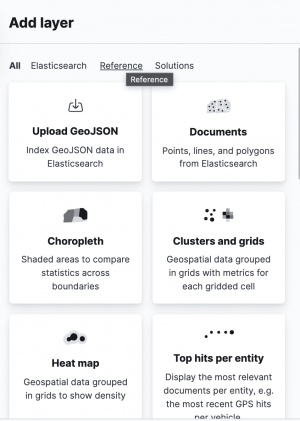
- In the index pattern menu select logstash*
- Click

- Enter the name events
- Click

- In the top menu bar, click on the time selector on the far right.
- Click Absolute.
- Set the start time to May 18, 2015 and the end time to May 20, 2015.
- Click Update.
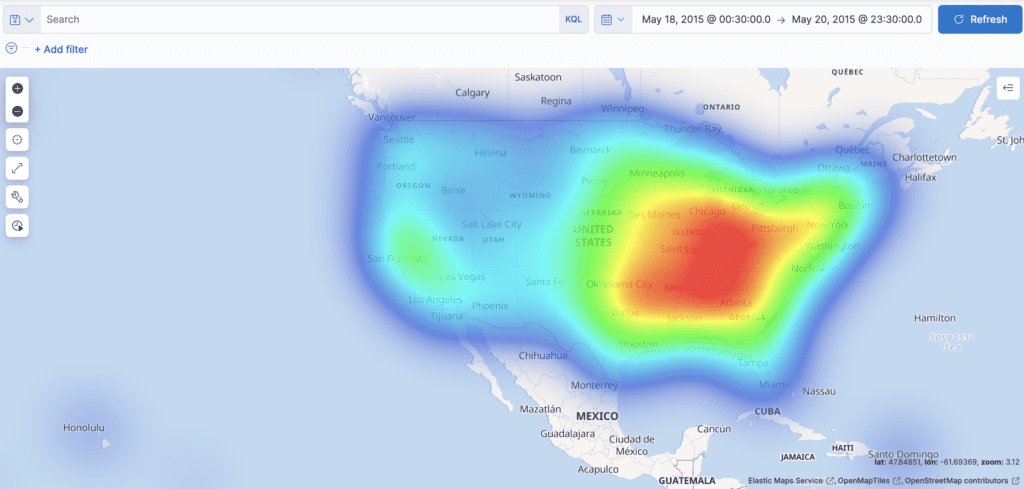
To save this chart
- Click on Save in the top menu bar and enter Map Example
- Select None from the Add to dashboard options
- Click

Text
The final display is a Markdown widget that renders the formatted text.
- In the visualization type menu, select Text under Tools. In the text box, enter the following:
# This is a tutorial dashboard!
The Markdown widget uses **markdown** syntax.
> Blockquotes in Markdown use the > character.
- Click

The Markdown is displayed in the preview panel:
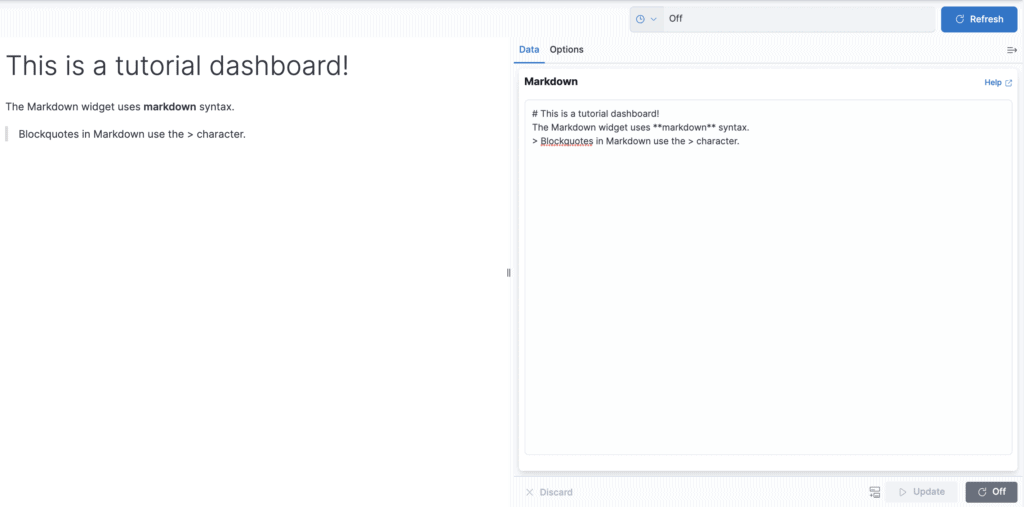
To save this chart
- Click on Save in the top menu bar and enter Markdown Example
- Select None from the Add to dashboard options
- Click

Adding visualizations to a dashboard
A dashboard is a collection of visualizations that you can organize and share. You will build a dashboard that contains the visualizations you saved during this tutorial.
- Open Dashboard
- Click

- Click

- Add Bar Example, Map Example, Markdown Example, and Pie Example.
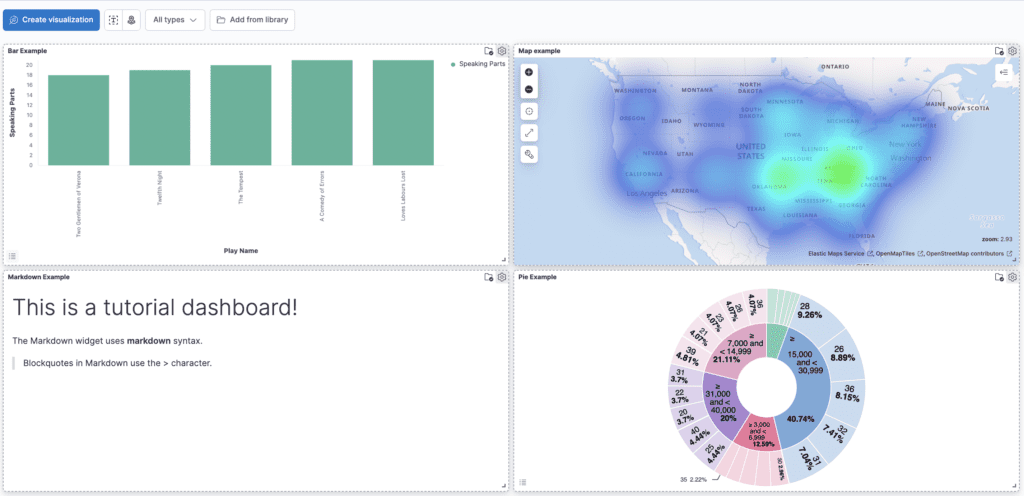
You can rearrange views by clicking on a view’s header and dragging it. The gear icon at the top right of a view shows controls for editing and deleting the view. A resize control is in the lower right corner.
To get a link to share or HTML code to embed the dashboard in a web page, save the dashboard. The Share button allows you to share the dashboard as Embedded code, Permalinks, PDF and PNG reports.

