ElasticSearch 8: new features of the new version
Elastisearch is a NoSQL database used primarily for building search engines. In fact, thanks to the integration of Apache Lucene it allows to properly index text documents and perform very accurate searches. The new release introduces some new features and improvements over version 7.
Kibana: build your own dashboard
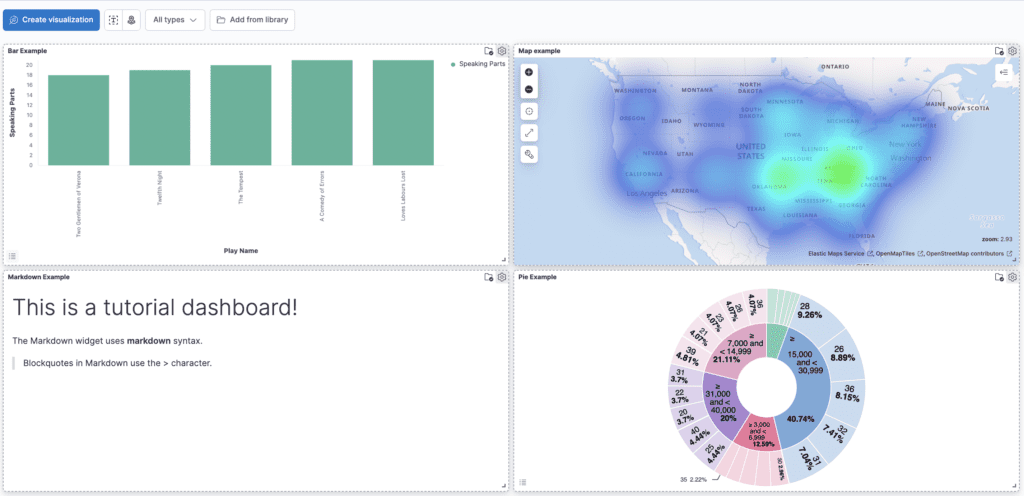
With Kibana it is possible to build custom dashboards to display our data in an appropriate way. There are different types of visualization including pie charts, bar charts and geographic maps. In this tutorial we’ll discover how to build a custom dashboard starting with data entry.
Kibana: let’s explore data
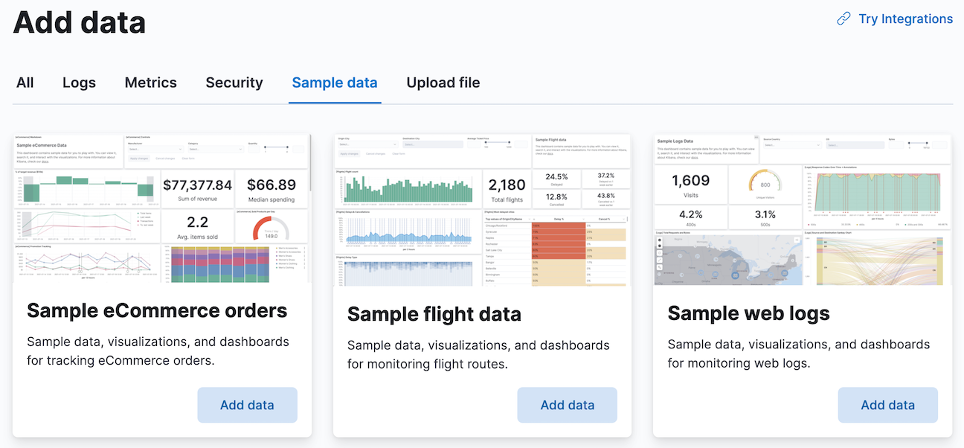
Kibana, ELK Stack’s data visualization tool, offers several methodologies to graphically represent and explore data. Thanks to some example data, you can better understand the potential of this tool. In this tutorial we will discover some of them.
What is Kibana used for?
Data visualization plays a vital role in many activities. There are several tools, both open-source and paid, that allow us to create intuitive representations of our data. Among them we can’t mention Kibana, the data visualization tool by ELK Stack. Let’s find out what are its main features and not slo those dedicated to visualization.
ELK Stack: what it is and what it is used for

ELK Stack, an acronym for Elasticsearch – LogStash – Kibana, is a valuable tool for data ingest and analysis in various application contexts. Initially born to support the textual research, today its functionalities have increased considerably. In fact, it is possible to ingest data using Beats and LogStash and/or create interactive dashboards of analysis using Kibana. Let’s discover its main features.
