Plotly Go: advanced visualization in Python

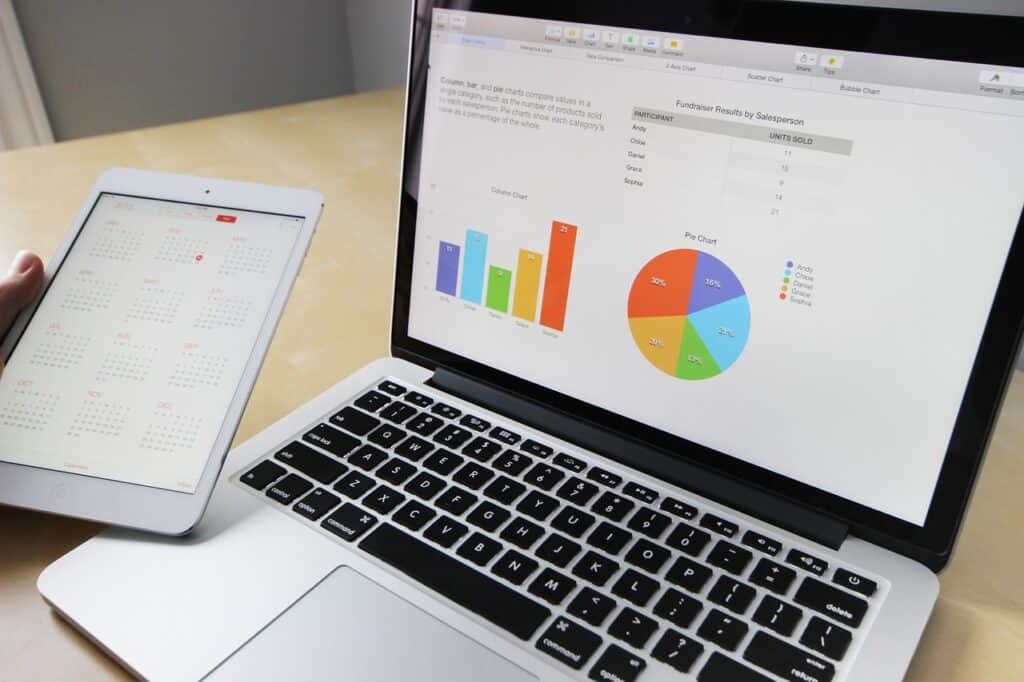
Visualizing data is critical to better understand the data and analysis performed. There are several tools, free and paid, that allow you to create fantastic dashboards. However, it is possible to write a few riches in Python to get great results and be more flexible depending on the project of interest. Let’s find out how to create interactive Scatter Bubble charts with Plotly Go on a real project.
