Google Data Studio: introduction to charts

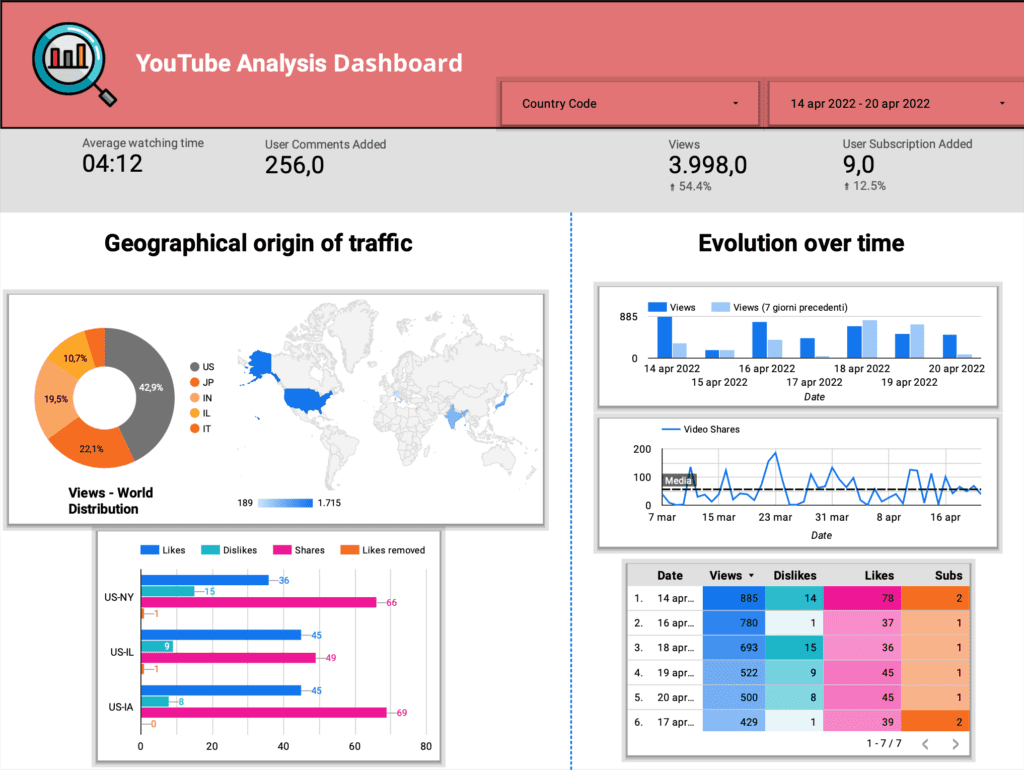
Once you become familiar with the Google Data Studio platform, the next natural step is to play with the breadth of available charts. They can be especially useful for highlighting trends and analysis of various kinds, making the final report much more useful and satisfying. In this tutorial, we will explore the main elements to customize your project.
