Pandas and Bokeh: create interactive graphics

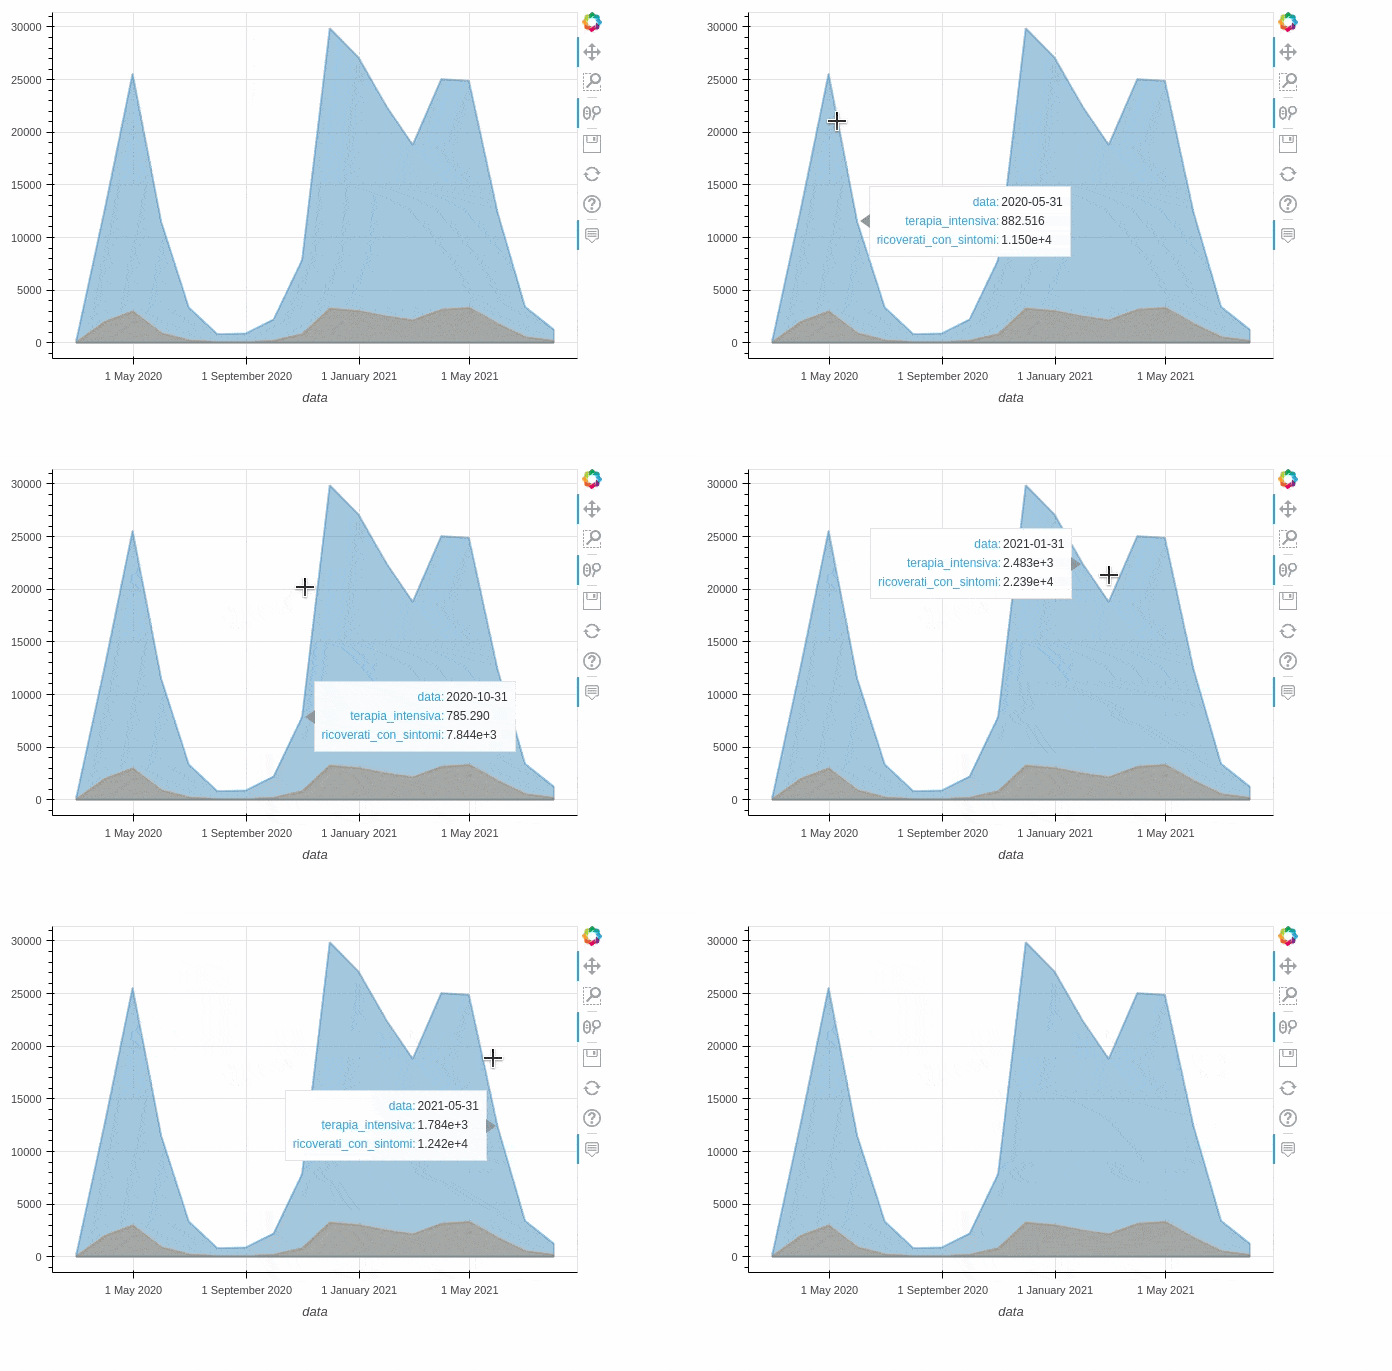
Analyzing data also requires graphing the data or the results from the analysis performed. Many libraries in Python provide useful tools for visualization, but the plots produced are static. The Pandas Bokeh library is a great alternative for creating interactive plots and including them in web projects. Let’s find out how to use it and the results we can achieve through some examples.
